Extra Credit
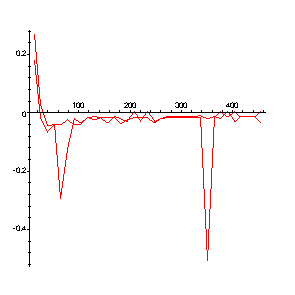
Extra Credit: Describe what I am doing in the following commands. What does the graph tell us about our experiment
![]()
Hint: You will need ?blah to understand some of the commands
>
fd := x -> x[2..nops(x)] - x[1..nops(x)-1];
dd := (x,y) -> zip( (x,y)->y/x, fd(x), fd(y));
![]()
![]()
> df := dd(times,CreamFirst):
> dl := dd(times,CreamLast):
>
>
plot(zip((x,y)->[x,y], times[1..nops(times)-1], df)):
plot(zip((x,y)->[x,y], times[1..nops(times)-1], dl)):
display([%,%%]);

>