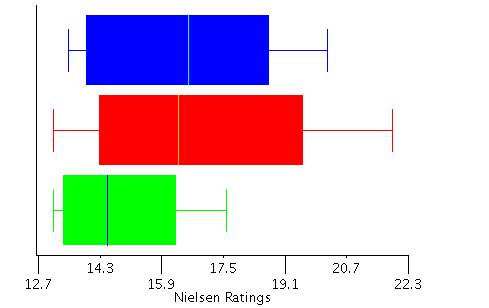
The following is data for Nielsen ratings points (that roughly represent the percentage of households tuned in). Use the boxplots below to decide who to award "best network" to?
a) ABC (top boxplot)
b) CBS (middle)
c) NBC (bottom)
d) There should be more than 1 winner
e) other
Discuss how to spin the statistics positively for each network:
Here's good news, we are the best network because...
Nielsen ratings using a
scale balancing idea for CBS (the middle graph).
a) Mean is probably higher than the median
b) Mean is probably lower than the median
c) Mean probably equals the median