| 2.1 | 1.56 | 1.56 | 1.96 | 1.92 | 1.44 | 1.4 | 1.27 | -0.06 | 1.26 | 1.85 |
| 1910 | 1911 | 1912 | 1913 | 1914 | 1915 | 1916 | 1917 | 1918 | 1919 | 1920 |
- 1918 would drag the average down from the median
- 1918 would drag the average up from the median
- 1918 would leave the average alone
What happened in 1918?
1.56. 1.48.
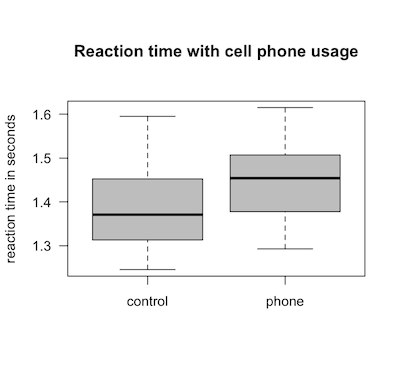
What can you say about the data from the median to q3 of the reaction times?
- The cell phone users did better because the data is more tightly clustered together
- The control group did better because the data is lower on the graph
- neither
- 95
- 5
- other
- yes
- no
- yes
- no
- It is still valid as is
- Garbage in garbage out, so the margin of error would not represent the entire population, although it would still be useful to interpret whatever biased sample it did represent.
- Sample A: a sample of n = 1000 from a population of 10 million
- Sample B: a sample of n = 2500 from a population of 200 million
- Sample C: a sample of n = 400 from a population of 50,000
defs