Stock Market Data

NAME_________________________________


For homework you read about the stock market and completed a number of web searches that you will use today. The stock market is at the center of the United States economy. Even if you have no money in the stock market it still affects you. You will track your stock over the course of the semester, so keep this packet handy. In future labs, we will use the data that you collected (and posted on ASULearn) and the graph that you will print out today, so do not delete your file.
  • Choose your favorite stock symbol from your homework. Be sure that you do not have the same stock as any of your immediate neighbors (introduce yourself and ask them!)
    Go to finance.yahoo.com, and enter your symbol in, and then hit the "Get Quotes" key.

    Getting Historical Data from Yahoo and Converting it to an Excel Chart Follow Carefully!

    Finding the Data
  • Click on the Historical Prices link and change the start date to Aug 1, 2008 so that you have approximately 3 months of daily data.
  • Click on Get Prices

    Go down to the bottom of the page and control-click on the Download to Spreadsheet link and then "Save linked File or Download Linked File" to the computer.

    From Excel, under File, release on Open, change Enable to All Files (from All Readable Documents) and then find the file called table.csv. Be sure that you have approximately 3 months worth of data.

    Saving Your File Under File, release on Save As...
    Change the name to
    yourfirstnameyourstocksymbol.xls
    (for example drsarahmsft.xls). Be sure there aren't any spaces!
    Change the Format from CSV (Comma Delimited) to Excel 97-2004 Workbook (.xls) (at the top of the Format options), so that Excel can open it again later with our work.
    Show this to me and get it approved.
    Once you have approval, save your excel document.


    Working With the Data in Excel to Create a Chart
    Notice that the Date will be in the first column, Open price in the 2nd, High price in the 3rd, Low price in the fourth, Close price in the fifth, Volume in the sixth, and Adj. Close* in the seventh. You read about these for homework.
    Follow Carefully: Click on A1 which has the word Date in it (NOT the gray A). Click on the Sort Ascending icon in Excel (Under View, make sure that Toolbars/Standard is checked since the Sort Ascending button is located on this.)
    Notice that now the data is now in increasing order by Date - when you clicked on the sort ascending button using the word Date, your entire chart was reordered. One must be very careful with this button in general!
    We want to change one more thing before we create an Excel graph.
    Click on B1
    Under Insert, release on Columns.
    Now there is an empty column between date and open.
    Click on the gray box G (which is now where the Volume is located) so that the entire Volume column is highlighted.
    Under Edit release on Cut
    Click on the gray box B (the empty column)
    Under Edit release on Paste
    Notice that now our columns look like Date - Volume - Open - High -Low - Close - Empty Column - Adj. Close*
    Click on the gray box H (where the Adj. Close* is located) and Under Edit, release on Delete.
    Notice that now our columns look like Date - Volume - Open - High -Low - Close

    Saving Your File Save your excel document again - under File, release on Save.


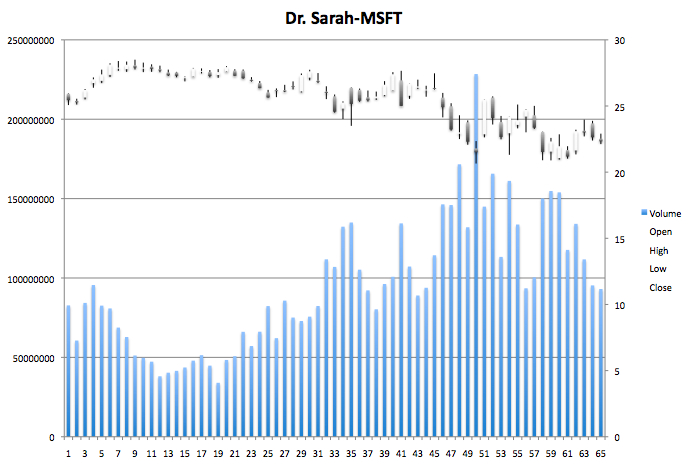
    To create our Excel graph
    Click on the grey box B
    Click on the Command key on the keyboard that has an apple with a bite taken out of it and hold this key down.
    Continue to hold the key down as you click on C then D then E then F.
    Then columns B thru F will all be selected in that order.
    Under Insert, release on Chart
    On the green menu click on Stock
    Under Chart sub-type, click on the far right picture (Volume-Open-high-low)
    Click on the Toolbox
    Under Chart Options / Titles /Chart Title, enter in something like Dr. Sarah - MSFT
    Then close the Toolbox.

    Have me check your chart. To print a full page version of just the chart:
  • Under File/Page Setup, click on Landscape and hit ok
  • Select the Chart by clicking on it.
  • On the Chart menu, click Move Chart
  • Click New Sheet and click Ok
    If you do not have money on your card to print, then perhaps a neighbor will let you use their's or print this sometime outside of class by accessing it from ASULearn. You want a full size printout of the graph, which we will use as we analyze the statistics of the stock market.

    Send yourself a copy via posting it as follows:
    Go to the main ASULearn page
    Click on the personal file storage space
    Attach your file - look in the public folder on the desktop for your file (example drsarahmsft.xls)
    You will know if you have been successful if you see your attached file when you are finished.
    You will use this again in future labs, so do not delete it.

    Staple the printed graph to the back of this sheet and continue working below.

    Total "Purchase" Price

  • What is your stock symbol?

  • What does this symbol stand for?

    Go to finance.yahoo.com, and enter your symbol in, and then hit the "Get Quotes" key. You may see Bid and Ask prices, or it may say N/A. Bid is the selling price, and Ask is the asking price that you must purchase at. The Ask price (purchase price) is higher than the Bid price (selling price). This makes sense since, for example, farmers sell their products for much less money than we pay for the products because distributors earn the difference. The stock market works the same way.
  • What is your Ask price? (Ignore the "x 100" or similar part of the Ask price - you want the price per share that comes before this in the Ask price.) If you don't see an Ask price then follow these directions: (If you have your Ask price listed then go to the next bolded "dot".) Note that if the market is closed, or if your stock does not have 4 letters, then you may see n/a next to bid and ask. Each stock does have bid/ask prices, but only the Nasdaq stocks are publicly available (you could get the others by having an account at e-trade, or by asking a stock broker, but that is too complicated for now.)
    So, ONLY if you don't already have an Ask price, then take the Last Trade price and write that down here.
    Your ask price will be the Last Trade price +.125, so now fill in your ask price above.
  • Note that the Ask price is a price per share. We will "buy" 100 shares. But this isn't the total cost, since we must also pay a commission fee. The following is from e-trade.
    Nasdaq (4 letter name): 19.95                    Other: 1, 2 or 3 letter name: 14.95
    You pay these fees each time you buy or sell. They may seem high, but standard commission fees were a couple of hundred dollars before the (relatively recent) advent of internet trading sites.
  • What is the total cost of purchasing your stock ( Ask price x 100 + commission fee)? SHOW WORK!


  • Show me your correct work and then go back to the class highlights page and begin working on the next part.


    ***Ignore the rest of this sheet (the "Updates") until I tell you to fill them in (during future labs).***


    Update #1 - "What if" I sell today? First Copy the following info from above: Total "Purchase" Price on the original day you "bought it"
    Go to finance.yahoo.com, and enter your symbol.
  • What is your Bid price? If you don't see a bid price:(if you did go instead to the next bolded "dot" question below) Note that if the market is closed, or if your stock does not have 4 letters, then you may see n/a next to bid and ask. Each stock does have bid/ask prices, but only the Nasdaq stocks are publicly available (you could get the others by having an account at e-trade, or by asking a stock broker, but that is too complicated for now.)
    So, ONLY if you don't already have a Bid price, then take the Last Trade price and write that down here.
    Your bid price will be the Last Trade price -.125, so now fill in your bid price above. Show work.
  • Note that the Bid price is a price per share. We want to know what happens if we were to "sell" our 100 shares. But this isn't the total cost, since we must also pay a commission fee. The following is from e-trade. Circle the one that applies to your stock
    Nasdaq (4 letter name): 19.95                    Other: 1, 2 or 3 letter name: 14.95
    You pay these fees each time you buy or sell. They may seem high, but standard commission fees were a couple of hundred dollars before the (relatively recent) advent of internet trading sites.
  • What is the total money you will get back if you sell your shares today? Note that we must pay the commission fee again, so we get that much less back. (Bid price x 100 - commission fee)? SHOW WORK!

  • UPDATE #1 What would your total gain be (total money you would get back if you sold your shares today - total you spent to purchase the stock when you originally "bought" it)? If the answer is negative, leave that in, since that indicates a loss. SHOW WORK!

  • Write down today's date.
    We will do periodic updates throughout the semester. I will let you know when to fill in the following.
  • UPDATE #2 Use the directions to calculate the "total money you will get back if you sell your shares today" using today's Bid price. What would your total gain be (total money you would get back if you sold your shares today - total you spent to purchase your stock when you originally "bought" it)? If the answer is negative, leave that in, since that indicates a loss. SHOW WORK!


  • Write down today's date.
  • UPDATE #3 Use the directions to calculate the "total money you will get back if you sell your shares today" using today's Bid price. What would your total gain be (total money you would get back if you sold your shares today (Bid price x 100 - commission fee) - total you spent to purchase your stock when you originally "bought" it)? If the answer is negative, leave that in, since that indicates a loss. SHOW WORK!


  • Write down today's date.