Class Activities on Perspective Drawing and Projective Geometry

Leonardo Da Vinci and Brook Taylor researched the question of how to find the viewing distance of a painting, and Taylor's 1715 work was published in Linear Perspective: Or, a New Method of Representing Justly All Manner of Objects as They Appear to the Eye in All Situations London: R. Knaplock.

Calculating the Viewing Distance for Interior of Antwerp Cathedral, by Peter Neeffs the Elder, 1651

In the figure below, we see the trick applied to finding the viewpoint for the Interior of Antwerp Cathedral painting. We first determine the vanishing point V directly in front of us, which is easy to see, as it is the intersection of lines which are supposed to be parallel in the real-world. Some of the lines have been drawn in below in order to highlight V. Notice that lines that follow along the edges (coming from us towards V) of the square tiles of the floor also intersect at V. Since the floor tiles are squares, they serve the same purpose as the square top of the cube in the previous discussion. Hence, our second point V' is calculated by following along a diagonal (indicated on the picture) that follows along the vertices of the square tiles. If we had chosen the diagonals of other square tiles, we still would have converged to V', or to a point V'' on the other side of V that is also d units away from V. In either case, the viewing distance d is the indicated length, and the correct viewpoint is directly in front of the main vanishing point V.

Although it is not possible to tell by viewing this small reproduction of Interior of Antwerp Cathedral, the effect of viewing the actual painting in the Indianapolis Museum of Art gives a surprising sensation of depth, of being "in" the cathedral. The viewing distance is only about 24 inches, so most viewers never view the painting from the best spot for the sensation of depth!


Come One - Come All - to a Better Cube


  • Measure the viewing distance d with your fingers.
  • Turn hour hand 90 degrees so that the distance is now in front of V.
  • Move until your left eye is exactly d units directly in front of V, close the other eye, and let your left eye roll down to the box.
  • The rectangular distortion should go away and it should look much more like a cube!

    Using Mathematics to Create Precise Perspective Drawings and Computer Animations

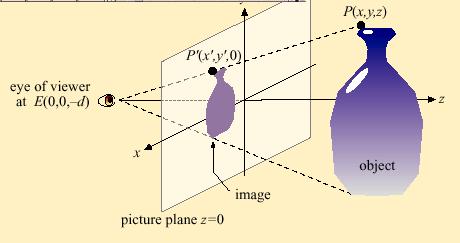
    Mathematicians and artists found the precise mathematical rules for perspective drawing. Understanding just a little bit about these rules can help us understand art and computer animation.

    A viewer's eye is located at the point E=(0,0,-d) in the (x,y,z) coordinate system located in 3-space (ie x=0, y=0, z=-d). Notice that just one eye is used. Out in the real world is an object, represented by a vase here. As light rays from points on the object (such as the point P(x,y,z) on the vase) travel in straight lines to the viewer's eye, they pierce the picture plane (the x-y plane where z=0), and we imagine them leaving behind appropriately colored dots, such as the point P'(x',y',0). The collection of all projection points P' comprise the perspective image (the perspective drawing) of the object.

    Perspective Theorem

    Given a point (x,y,z) of a real-life object with z > 0, the projections of these real-life 3D vase coordinates onto the 2D sheet (the perspective drawing coordinates) are given by the mathematical formulas.
    x' = (d x) / (z+d)
    y' = (d y) / (z+d)
    where d is the distance from the viewer's eye at (0,0,-d) to the picture plane (z=0).
    Hence, given a real-life 3-D object, the artist will draw x' and y' on their 2-D sheet.

    Example

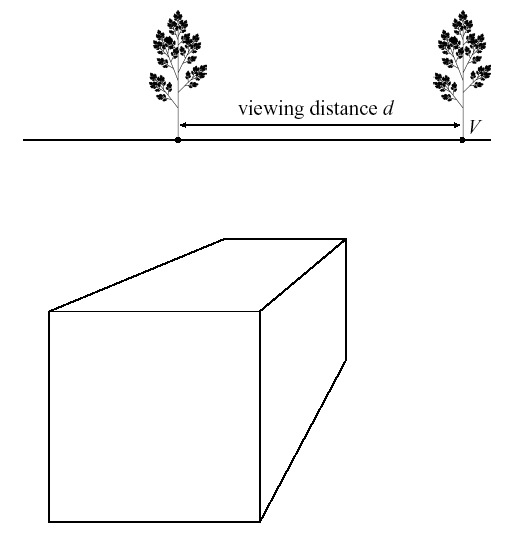
    Suppose the viewer is 3 units from the picture plane. If P(2,4,5) is a point on an object we wish to paint, find the picture plane coordinates (x', y') of the perspective image of P.

    Solution

    We have d=3, x=2, y=4, z=5. Thus
    x'=(d x) / (z+d) = (3*2)/(5+3)=6/8=3/4 and
    y'=(d y) / (z+d) =(3*4)/(5+3)=12/8=3/2.

    As a second example, we might want to make a perspective drawing of a real-life Christmas tree. We first put a dot at the image (x',y') of a point (x,y,z) where the coordinates of x' and y' are given by the perspective theorem as above. Then we continue to trace all possible such lines, accumulating all possible points P' associated with our original object. Once we have done this, we will end up with a perspective drawing of our Christmas tree.

    Perspective Drawings on a Computer

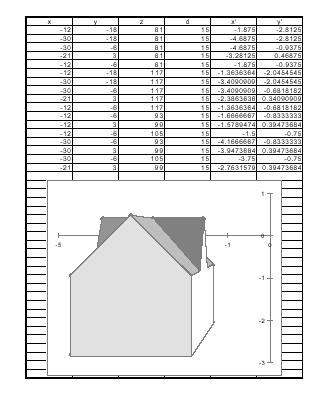
    We are going to make the computer create a perspective drawing of a house by using the above equations.

    Download and open this Excel file using the program with the green X. You will see a chart that is partly filled in with real-life x, y and z coordinates of a house (in columns A, B and C, respectively). We will use the viewing distance of 15 (as in column D) to calculate x' and y', and create a perspective drawing of it in Excel. So, we want to mathematically project the three dimensional house onto the mathematically precise perspective image in the plane (where we can draw it).
    So, we want to transform x, y and z to new coordinates x'=(d x)/(z+d) and y'=(d y) /(z+d). We will make Excel do these formulas for us!.
  • To transform x to x', click on E2 in the Excel sheet (row 2, column E). The Excel formula for x' that you should type in is:
    =d2*a2/(c2+d2)
    so type this formula (on the above line) into E2 and hit return. You should now see -1.875. Since d is in the d2 box, x is in the a2 box, and z is in the c2 box, we see that the Excel formula that we just typed in -
    =d2*a2/(c2+d2)
    is the correct formula to use in order to find the 2-D perspective coordinates of the given 3-D point, since it corresponds to the formula
    x'=(d x)/(z+d)
    Click on E2 again. At the bottom right corner of E2 scroll until you get a square with arrows which looks like . Then click, hold down, and fill down the Excel column by scrolling down and releasing in E18. The number you will see there is -2.7631579.

    What Excel formula should we use in F2 corresponding to y'=(d y)/(z+d)?

    Enter your forumula into F2 and hit return. You should now see -2.8125. At the bottom corner of F2 click until you get a square with arrows. Then fill down the Excel column and release in F18. The number you will see there is .39473684.
  • To draw our house, click on the grey E box, so that that column is highlighted. Then hold down the shift key while you click on the grey F box, so that both the E and F columns are now highlighted. Under Insert, release on Chart. Then click on XY (Scatter) and then on Finish. Now we have our mathematical drawing, but it doesn't look very impressive. Some of the points of the house are behind our viewpoint, and are only there if we want to change our view (like by making the house rotate).

    To see the final picture, all we would have to do is connect the dots and shade in the figure, as in the image below


    Digital Movies

    Digital animations such as use many more rows of Excel. The full-body version of this Yoda uses 53,756 vertices!

    Models created by Kecskemeti B. Zoltan and visualized by T. Chartier. Images courtesy of Lucasfilm LTD as on Using the Force of Math in Star Wars


    Adapted from Marc Frantz's Mathematics and Art.