Selections from the web Readings and Activities on Perspective Drawing and Projective Geometry. Note that the beginning and remainder of the readings are on the web - I'm not printing out the entire document in order to save paper.

Begin by reading on the web up until...

Click on this link of the large drawing and do as follows as you have a partner read you these directions:

  • Close your right eye.
  • Place your left eye directly in front of the point V (NOT in the center of the page!). You will need to get very close to the computer screen to do this.
  • Use a thumb and a forefinger to measure the distance between V and V' which you should see as 2 dots at the very top of your screen.
  • Use this to measure out d units in front of V. Move until your left eye is exactly d units away from V on the computer screen. You will still be very close to the computer screen!
  • Without changing your position, let your eye roll down and to the left and then look at the box. Although it may be too close for comfortable viewing because you will be so close to the computer screen, the distortion should go away and it should look much more like a cube! Most people will be able to see this by following the directions, but some people may have problems due to glasses, ...
  • Now switch roles and read the directions to your partner as they complete this activity.
    Continue by reading on the web up until...

    Perspective Drawing in Excel We are going to make a perspective drawing of a house in Excel using the above equations. Work in a group of 2. 1 person should read these directions to the 2nd person, while the 2nd person actually does this on their computer. You only need to do 1 Excel house per group. Click on this excel file from Internet Explorer. The computer will download the file onto the computer. Open up Microsoft Excel by clicking on the green X icon on the Dock. From Excel, use File and release on open and then look for the file perspectivehouse.xls on the Desktop or in the Documents folder. You will see a chart that is partly filled in with real-life x, y and z coordinates of a house (in columns A, B and C, respectively). We will use the viewing distance of 15 (as in column D) to calculate x' and y', and create a perspective drawing of it in Excel. So, we want to mathematically project the three dimensional house onto the mathematically precise perspective image in the plane (where we can draw it).
    So, we want to transform x, y and z to new coordinates x'=(d x)/(z+d) and y'=(d y) /(z+d). We will make Excel do these formulas for us!.
  • To transform x to x', click on E2 in the Excel sheet (row 2, column E). The Excel formula for x' that you should type in is:
    =d2*a2/(c2+d2)
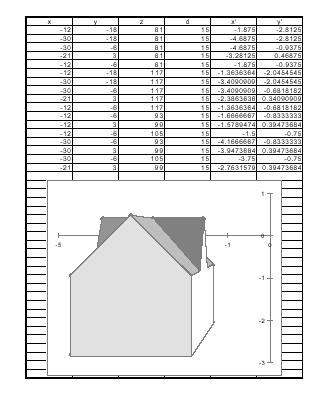
    so type this formula (on the above line) into E2 and hit return. You should now see -1.875.
    Since d is in the d2 box, x is in the a2 box, and z is in the c2 box, we see that the Excel formula that we just typed in -
    =d2*a2/(c2+d2)
    is the correct formula to use in order to find the 2-D perspective coordinates of the given 3-D point, since it corresponds to the formula
    x'=(d x)/(z+d)
    Be sure that you understand this before moving on. Click on E2 again. At the bottom right corner of E2 scroll until you get a square with arrows which looks like . Then click, hold down, and fill down the Excel column by scrolling down and releasing in E18. The number you will see there is -2.7631579.
  • To transform y', click on F2 in the Excel sheet. Figure out the Excel formula corresponding to y'=(d y)/(z+d) (hint - first make sure you understand the Excel formula that we used for x', and then figure out the corresponding Excel formula for y') and then type your Excel formula into F2 and hit return. You should now see -2.8125. At the bottom corner of F2 click until you get a square with arrows. Then fill down the Excel column and release in F18. The number you will see there is .39473684.
  • To draw our house, click on the grey E box, so that that column is highlighted. Then hold down the shift key while you click on the grey F box, so that both the E and F columns are now highlighted. Under Insert, release on Chart. Then click on XY (Scatter) and then on Finish. Now we have our mathematical drawing! All we have to do is connect the dots (see below)
  • Click on the blue or grey background part of your chart. Under View, scroll to toolbars, and then release on drawing. A "drawing toolbar" will appear. Click on the line that is just a straight line (no arrow heads or anything).
    Your mouse should now be a thin cross when you take it to your picture.
    We want to connect the dots to make the picture represented here.
  • Click on the bottom left point in the picture, hold down the mouse, and release on the point above it to draw the line representing the left side of the house. Then click on the blue part to complete the line.
  • Keep clicking on the line on the toolbar in order to draw lines on your picture in order to complete the picture as above.
  • To erase a line that you have drawn by mistake, click on the arrow in the drawing tools, and then go back to the picture. Hold the mouse over the line until it turns into a hand. Wait until it tells you Line (--) where (--) means some number. Then click down, and hit delete.
  • Dr. Sarah will show you how to use the dots to make lines that are not formed directly by connecting 2 dots (the line coming down from the top left of the roof and the little line from the top right of the base of the house connecting to the roof) First you make a complete line down to the corresponding dot, then make a line to the part that you desired, and then erase the longer line.
  • Show Dr. Sarah your completed house.