Class Activities on Perspective Drawing and Projective Geometry
The purpose of the lab component of the course
is to extend and build connections to course material
in an interactive manner using technology.
During labs you will work at your own pace,
preferably in groups of 2-3, as I make my way around the room to check in
(and help!).
Read and complete the activities as you answer any questions on
a sheet of paper, which I'll come around to look at.
Activity 1: Parallels
One definition of parallels is straight-feeling paths that never meet.
- Pick up the folding paper from the front of the room.
In Euclidean geometry, the flat geometry from high school (named for Euclid of Alexandria),
there is exactly one parallel to a line
through a given point. In fact we can show why and
find it by folding as follows
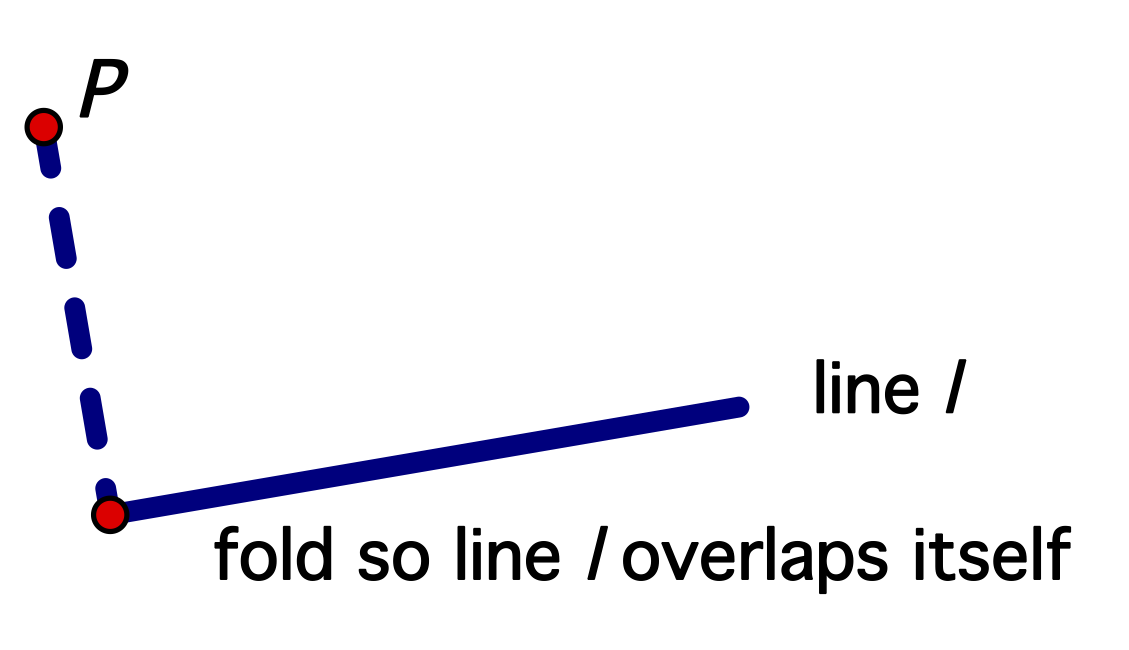
- Make a fold through point P so that the line overlaps itself. This creates a perpendicular to line l through point P as shown below
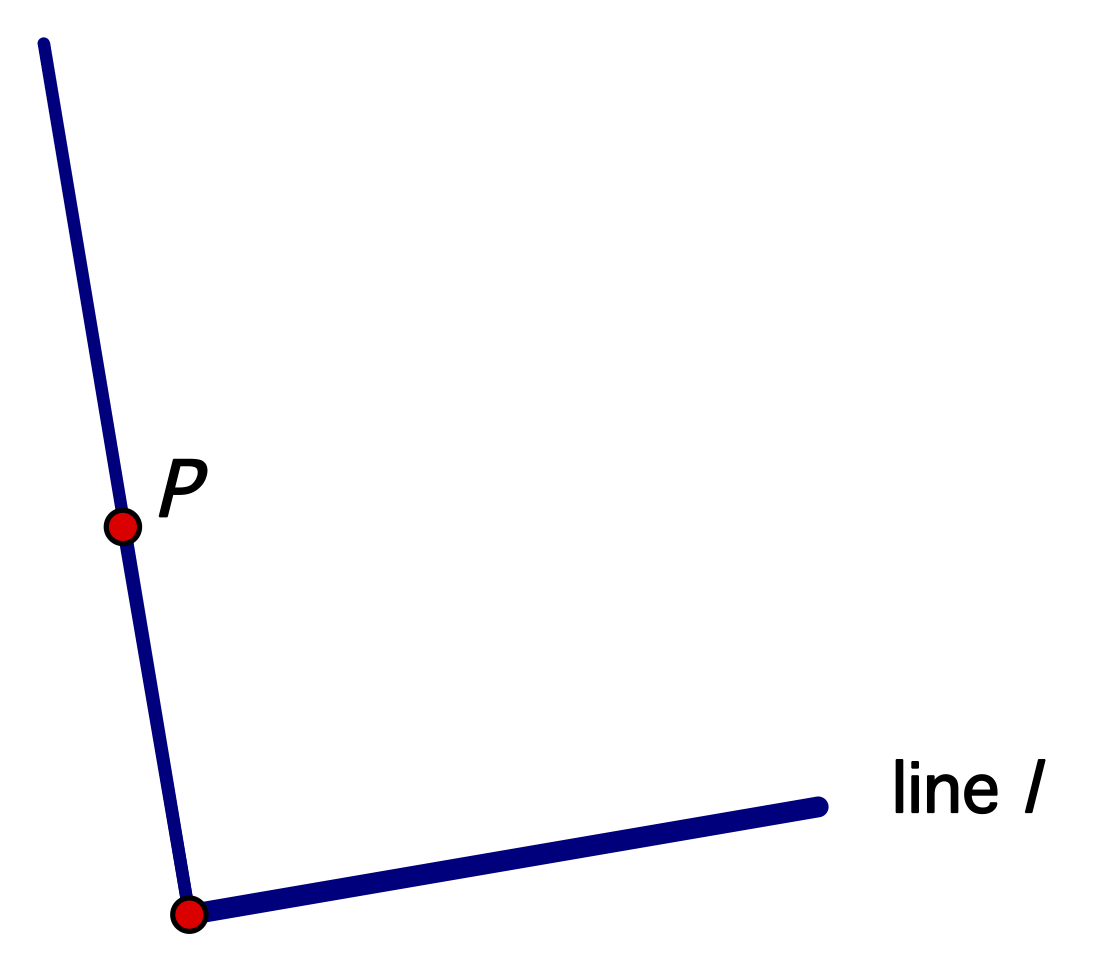
- Using a pen or marker, draw the perpendicular line you folded---on both sides of the paper---and go past P as shown below
- Next fold a perpendicular to the line you just drew through the point P.
To do this, make a fold through point P so that the new perpendicular line overlaps itself.
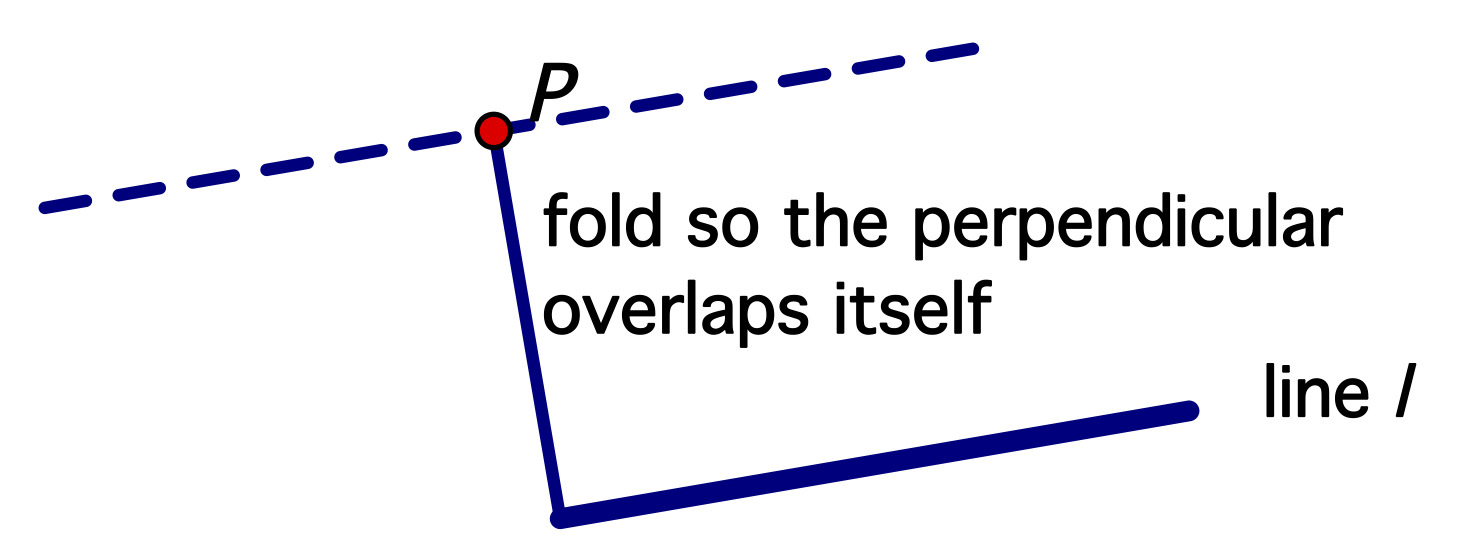
- You should have created the unique parallel to line l through point P. Does it look parallel? If not, try again.
Compare with a neighbor.
This is similar to Euclid's original construction of a parallel in Proposition 31 of Book 1 of Euclid's Elements. Carl Boyer, a historian of science, called Euclid's Elements the most fabulously successful and influential textbook of all time because of its reach
and importance in the development of mathematics and science.
- In non-Euclidean spaces, straight to us means that our feet will travel
on symmetric paths, i.e. that creatures will get cut in half as they
travel along such a path.
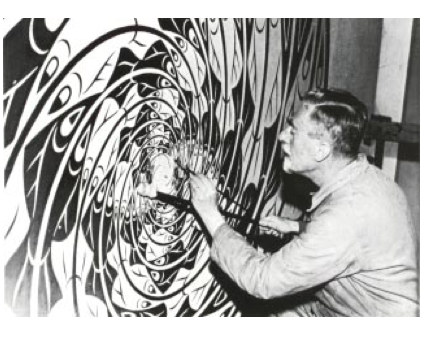
Here is M.C. Escher working on one of his sphere surfaces with fish.
He drew the symmetric path through each fish,
cutting it in half, showing they are swimming along straight-feeling paths.
All of these meet up at one point, like a North pole. Since all straight
paths intersect, there are no parallels in this particular work of Escher's.
Hyperbolic geometry, another non-Euclidean geometry, is different than spherical geometry.
How many parallels are through point P to line l in
Escher's Heaven and Hell representation of hyperbolic geometry?
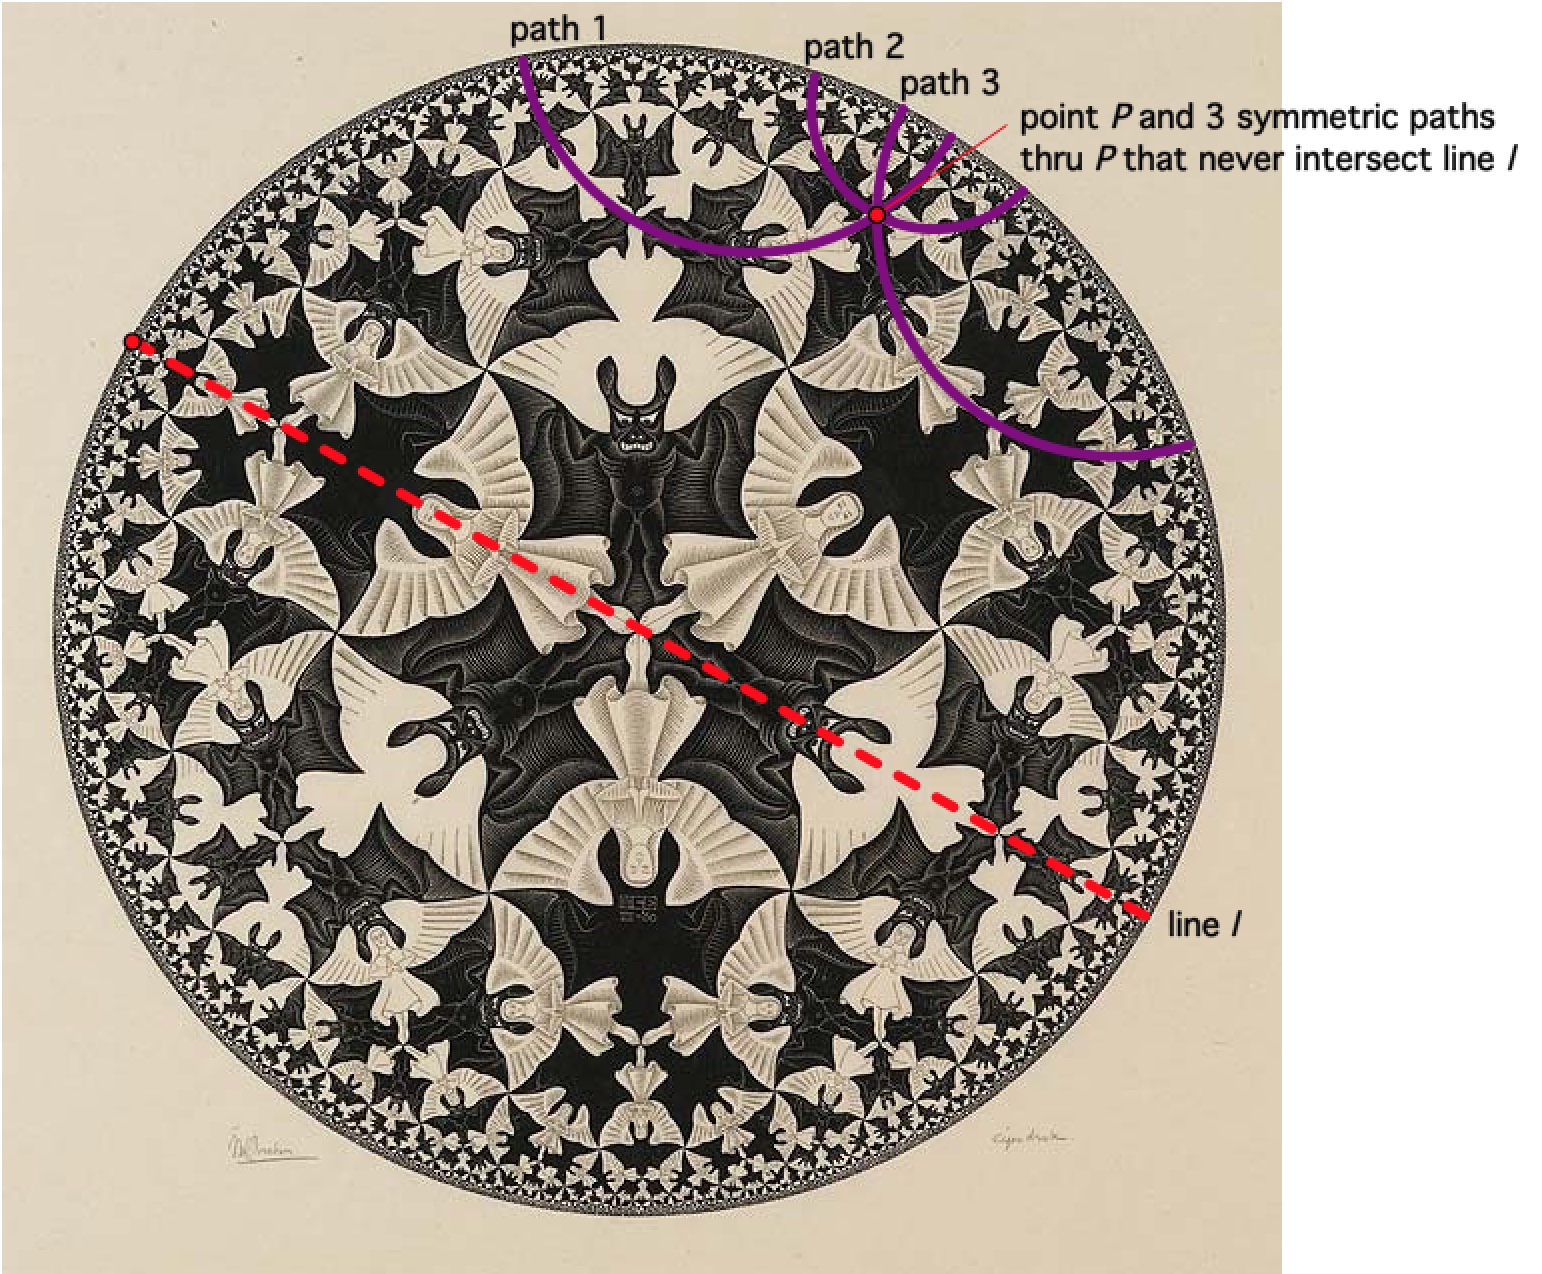
- In projective geometry and in perspective drawing, lines that were parallel in the real-world now intersect. How many parallels are in this
geometry?
- In terms of the number of parallels, is projective geometry and perspective drawing
most similar to hyperbolic geometry, flat Euclidean geometry, or spherical geometry?
Activity 2: Come One - Come All - to a Better Cube
A picture drawn in perspective
was drawn assuming that it would be viewed with one eye from a distance
d behind V, and so this is the mathematically
optimal viewing place and distance.
To test out our determination of d,
Have a partner read you these directions as you test them out on
this link of the large drawing
- Use a thumb and a forefinger to measure the distance d between
V and V' which you should see as 2 dots at the very top of your screen.
Keep this distance, called d, with your hand.
- Continuing to keep that distance, turn your hand
to measure out d units in front of V (so d is now
perpendicular to the screen instead of being inside of it).
- Place your left eye exactly at that same point (d
units in front of V -
not in the center of the page). You will need to get very close
to the computer screen to do this.
- Close your right eye.
- Without changing your position, let your left eye roll down and to the
left and then look at the box. Although it may be too close for
comfortable viewing because you will be so close to the
computer screen, the distortion should go away
and it should look much more like a cube! Most people will be able to
see this by following the directions, but some people may have problems
due to astigmatism...
- Now switch roles and
read the directions to your partner as they complete this activity.
- Were you able to see the distortion disappear? If not, make sure your eye is in the correct place and try again, but if you still can't see it, then mark down "no" for this question.
- As a review, briefly summarize where was your left eye placed and compare with a neighbor.
Viewers in a gallery or museum almost never
assume the correct perspective viewpoint, because these locations tend to be
rather low, off-center, rather close, etc. It's true that the artwork may
appear perfectly acceptable from most locations in the room. However, when
one assumes the correct viewpoint and looks with one eye, it is common for
the illusion of depth to be astonishingly more believable. You can almost
"feel" the space!
(Of course the work must be of high quality and very precise.)
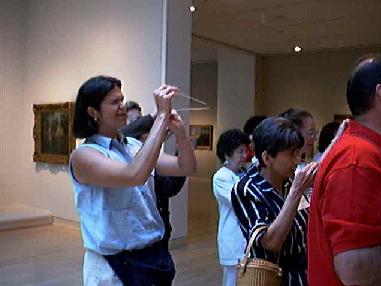
While you can't draw dashed lines on the artwork to find the viewing
distance, you can mentally trace appropriate lines by holding up shish
kebab skewers. Once you do so, you can use your hands to measure the
viewing distance in the painting and stand d units in front of V.

Activity 3: Using Mathematics to Create Precise Perspective Drawings and Computer Animations
-
Given a point (x,y,z) of a real-life object with the viewing
distance d > 0,
write out the mathematical equations for the
perspective drawing coordinates
of x' and y' that were given on
the homework reading.
We are going to make the computer create a perspective drawing of a house
by using these equations. Work with a partner - have one person
read the directions on their screen while the other performs the
instructions.
Microsoft Excel is an electronic spreadsheet program that we'll use to
algebraically manipulate and analyze data and create visualizations. One of the learning goals of the course is to employ spreadsheets to
help recognize patterns and similarities in numerical,
algebraic, and graphical representations and use
those representations to solve real-world problems.
Data
is organized into boxes or cells that are labeled by their row number and
column letter.
Download and open this
Excel file perspectivehouse.xls
using
the Excel program (green icon with X).
You will see a chart that is partly filled in with
real-life
coordinates x, y, z of a house (in columns a, b and C, respectively).
We will use the viewing distance of 15 (as in column d)
to calculate x' and y',
and create a perspective drawing of it in Excel.
So, we want to mathematically project
the three-dimensional house onto the
mathematically precise perspective image in the plane.
So, we want to transform x, y and z to new coordinates
x'=(d x)/(z+d) and y'=(d y) /(z+d).
We will make Excel do these formulas for us!
- To transform x to x', click on e2
in the Excel sheet
(row 2, column e).
The Excel version of the formula for x' that you should type in is:
=d2*a2/(c2+d2)
so type this formula (including the equals sign)
into e2 and hit return. You should now see -1.875.
Do you have any questions on the above? Make sure you understand the above before you continue.
To fill down the formula
to the other rows, we'll force Excel to change the
2s to 3s to 4s and so on.
Click on e2 again.
Move your cursor to the lower-right corner so that it turns into a black plus sign
 .
Click so that you keep the black + sign, hold down, and
fill down the Excel formula by scrolling down the column
vertically and releasing in e18. The number
you will see there is -2.7631579.
- What Excel formula should we use in f2
corresponding to y'=(d y)/(z+d) for the second row (don't forget
the equal sign in Excel!)?
- Enter your formula into f2 and hit return. You should now see -2.8125.
- At the bottom corner of f2 scroll until you have the + sign,
click, and then then fill down the Excel column and release in f18. The number
you will see there is .39473684.
- To draw our house, click on the grey e box, so that that column
is highlighted.
Then hold down the command key while you click on the
grey f box, so that both the e and f columns are now highlighted.
Excel has two types of menus, those at the very top of the screen, in grey background below,
and those on the spreadsheet
itself, which has a green background as below. We'll mostly be using the top menu items this semester.
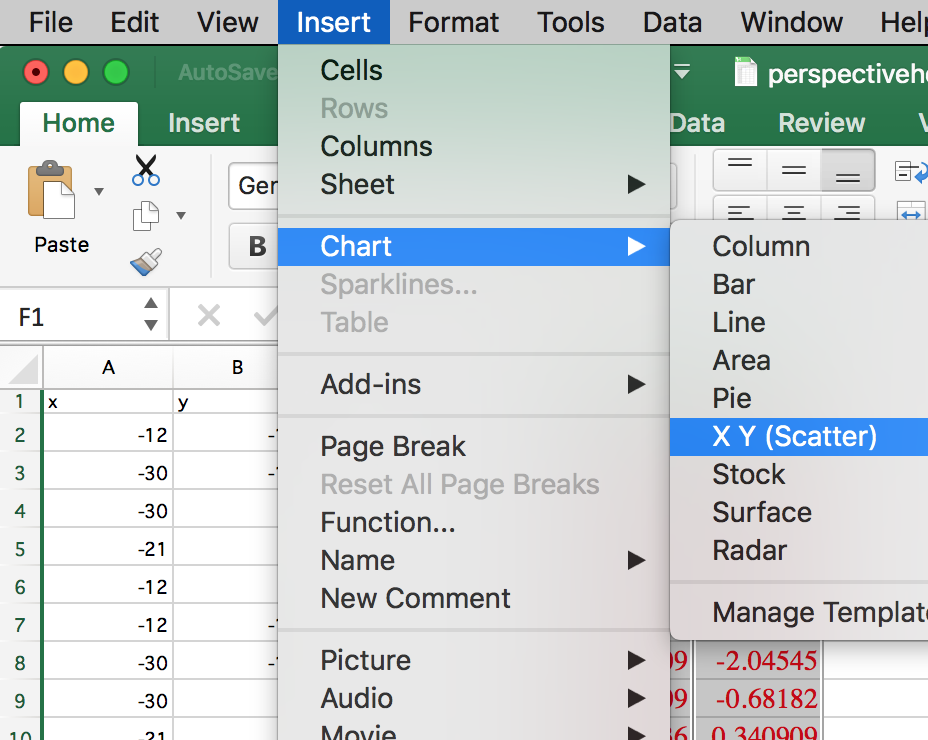
Under the Insert top menu, release on Chart
and then Scatter or XY (Scatter), as shown above.
- Compare what you have with the following image
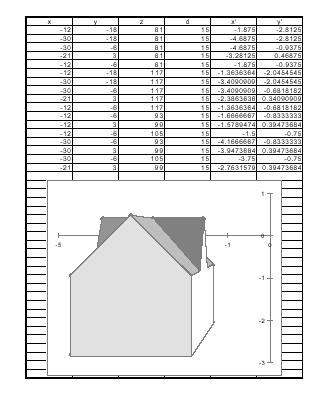
We have our mathematical drawing, but it doesn't
look as impressive. Some of the points of the house are behind our
viewpoint, and are only there if we want to change our view (like by making
the house rotate). To have the computer complete the house drawing, all we would have
to do is connect the dots and shade in the figure,
as in the image above (but don't do this now).
Can you see how your perspective drawing is the same as the above image?
Digital Movies
Digital animations such as
 use many more rows of Excel. The full-body version of
this Yoda uses 53,756 points!
Models created by Kecskemeti B. Zoltan and visualized by T. Chartier. Images courtesy of Lucasfilm LTD as on
Using the Force of Math in Star Wars
- Work with a neighbor to list the artists and mathematicians who are mentioned in the
perspective drawing homework reading
and give a very brief summary of their contributions.
Example: Julian Beever, pavement drawings in perspective
- Show me your responses to the above questions as I make my way around the room. When I think that I can look at your responses
during lab, like I anticipate for today, I'll do so. During some weeks I'll ask you to turn in the labs.
- Look over the homework for tomorrow from the main calendar page and ask
me any questions
- If there is time left in lab and you have already completed the above (including showing me your responses of numbers 1-10)
then you may leave (you may also stay and work during the remaining time).
Activities 2 and 3 are adapted
from Marc Frantz's Mathematics and Art.


 .
Click so that you keep the black + sign, hold down, and
fill down the Excel formula by scrolling down the column
vertically and releasing in e18. The number
you will see there is -2.7631579.


 use many more rows of Excel. The full-body version of
this Yoda uses 53,756 points!