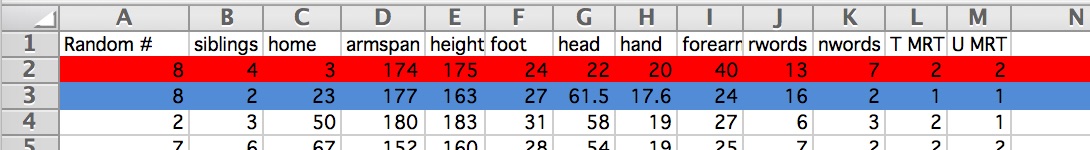
Statistics Detective Review and Stock Purchase
Work in groups. Use the
clues below and effective reasoning skills in order
to identify the "odd person out" in our
class data set as you review.
To mark off eliminated people on the computer, be sure that
View/Toolbar/Formatting is checked. You can use the fill-in feature
to eliminate suspects by
clicking on the row number
(in the grey number) and then the paint can
in the formatting toolbar. You may change fill-in colors by clicking on
the arrowhead just to the right of the paint can.
In this way, your document will show
suspects eliminated using the clues as painted rows, where color
represents a different clue:
 The suspect...
- supports the statement that says that the average person
is better able to remember real words than nonsense words.
So eliminate people who contradict the clue - ie
eliminate people who remember nonsense words at least as well as real words.
Choose a color for this clue and highlight any eliminated rows in that
color. Write down the clue 1 elimination color.
- has a golden mean of (1+sqrt(5))/2 ~ 1.618,
within a .2 margin of error,
embedded in the
forearm to hand
ratio as follows:
In O2 type =I2/H2 and hit return.
Then, go back up to that box, go to the bottom
right until you see the symbol that resembles a square with
arrowheads on the top left and bottom right corners,
click and pull the mouse down to fill down the column for the forearm to hand
ratios.
Which new rows can you eliminate? Eliminate those
who contradict the statement and have a
ratio less than ~1.418 or greater than ~1.818
(since the suspect lies in between)
eliminate anyone less than 1.418
eliminate anyone greater than 1.818
Choose a clue 2 color and highlight any new eliminations in Excel.
Write down the clue 2 elimination color.

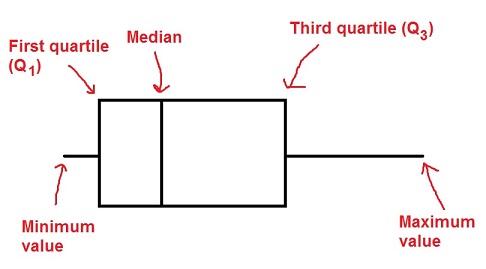
- falls within the middle 50% of the class on
the boxplot of the
distance from home
a. First, as a review,
sketch the boxplot by-hand after you type in
quartile commands in Excel to give you the 5-number summary:
=quartile(c2:c52,4)
=quartile(c2:c52,3)
=quartile(c2:c52,2)
=quartile(c2:c52,1)
=quartile(c2:c52,0)
Show me your sketch
Now eliminate rows who contradict the statement and who fall strictly
outside the box borders - ie
eliminate those who are strictly below q1 or strictly above q3
Choose a different color and highlight any new eliminations in Excel. Write down the clue 3 elimination color.

You should have 7 people remaining at this point. If not, check your clues and compare with others.
- hits the 3rd quartile (q3)
"on the head" for the number of competitors of
the family bathroom.
a. Which column does the clue apply to?
b. What is q3 of that column: =quartile(?2:?52,3), where you
replace ? with your response to part a.
eliminate those who are different than q3
You should have 2 people remaining at this point. If not, check your clues and compare with others.
Write down the rows that are left.
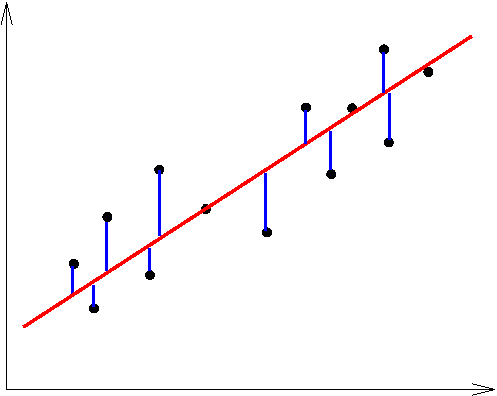
- has a y-value within 5cm of the best fit line for
"does armspan predict height."
a. What is the equation of the best fit line from the regression lab
(include all the (mis)measurements)? If you don't have your lab
responses, you'll need to reconstruct this.
b. Compute the predicted line value of height by plugging in the
armspan (the x value) of ONLY your remaining
suspects into the equation of the line. Show work.
Compare the predicted line height value with the actual height and
eliminate the person whose difference is greater than 5cm
c. Does the "winner" drag the line up or down? Ie is their actual height value above or below the line value?
Show work.
Once you have your clues completed, I'll come
over and check your work.
Then follow directions to purchase your stock.