The cafe-ole vs black coffee cooling experiment
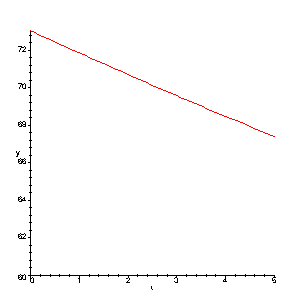
The following is a reasonable model for the cooling of hot water in our experiment, since room temperature was about 25 degrees celcius, and the temperature of the hot water was about 73 degrees celcius.
> T1:=unapply(rhs(dsolve({diff(T(t),t)=k*(25-T(t)),T(0)=73},T(t))),t);
![]()
In order to plot this, we will have to set a value for k. I obtained k=1/40 by looking at the resulting temperature at t=5 minutes - I
knew that I wanted this to be in the mid to upper 60s (degrees celcius) by the experiment we conducted with the CBL unit.
> k:=1/40:
> plot({T1(t)},t=0..5,y=60..73);

Why does this look like a straight line?
Let's look at data from a real life experiment:
EXPERIMENT SETUP:
2 identical mugs
milk
1/8 cup measurer
2 CBL units with temperature measuring probes
2 TI-83 calculators with heat programs installed
coffee urn filled with hot water
EXPERIMENT DIRECTIONS:
Dispense hot water from the urn into the creamfirst cup.
Dispense hot water from the urn into the creamlast cup.
Insert the temperature probe into the CBL and start the program so that the unit measures every 13 seconds.
Add 1/8 cup milk to creamfirst cup at time approximately equal to 1 minute
Add 1/8 cup milk to creamlast cup at time approximately equal to 5 minutes.
EXPERIMENT RESULTS:
> restart;
> times := [seq(13*i, i=1..36)]:
What is times?
CreamFirst is the temperature measurements from the creamfirst cup.
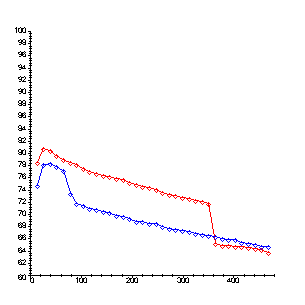
> CreamFirst := [74.51, 77.98, 78.26, 77.64, 77.1, 73.25, 71.58, 71.28, 70.82, 70.59, 70.37, 70.14, 69.69, 69.47, 69.18, 68.75, 68.75, 68.31, 68.31, 67.89, 67.6, 67.39, 67.18, 66.98, 66.77, 66.56, 66.42, 66.15, 65.95, 65.68, 65.68, 65.27, 65.07, 64.87, 64.67, 64.67]:
This changes the points into a desired format for plotting.
> CreamFirstPts := zip((t,y)->[t,y], times,CreamFirst):
> CreamLast := [78.38, 80.66, 80.37, 79.44, 78.87, 78.31, 77.97, 77.43, 76.89, 76.63, 76.3, 76.04, 75.78, 75.52, 75.01, 74.69, 74.44, 74.19, 73.94, 73.45, 73.14, 72.9, 72.66, 72.42, 72.19, 71.95, 71.72, 65.08, 64.82, 64.82, 64.62, 64.62, 64.43, 64.23, 64.04, 63.59]:
> CreamLastPts := zip((t,y)->[t,y], times,CreamLast):
> with(plots):
>
pfl := plot(CreamFirstPts, color=blue):
pfp := plot(CreamFirstPts, color=blue, style=point, symbol=diamond):
pll := plot(CreamLastPts, color=red):
plp := plot(CreamLastPts, color=red, style=point, symbol=diamond):
Guess at and describe what you expect to happen to the CreamFirst and CreamLast graphs without looking at the graph below.
Creamfirst will be blue and creamlast will be red. Without looking at the graph below, explain how you could tell the plots apart without having looked at the Maple commands ?
Call me over and show me your answers to the last two questions BEFORE executing the display command below.
>
>
plt1 := display([pfl,pfp, pll,plp], view=[0..480, 60..100]):
%;

Which takes less time to cool?
Extra Credit