- Should we expect the choice of random number to be correlated to armspan?
- Click on the grey A above ``Random Number" and then hold down the command key as you click on the grey B above Armspan.
Now both columns will be highlighted.
Under the Insert menu at the very top, look for and create the Chart that is XY (Scatter). If it didn't come out correctly you may have an extra box selected and may need to repeat the above steps.
Next use the control key as you click on one of the points on your graph and Add Trendline.
Under Format Trendline or Options select the bottom two options (Display equation on chart and Display R-squared value on chart). Click on the x to finish it, or OK.
Back on the chart, you can drag the equation of the line or resize the graph if you need to see it better.
What is the R2 value, as a percent? - Review the strength of the regression relationship. What is the strength in this case?
Does Armspan Predict Height? - Search the web to find information about Leonardo da Vinci's speculation about the relationship between armspan and height. Summarize what you found in your own words.
- What are some confounding issues that might get in the way of armspan being a moderate or strong predictor of height?
- Follow the above Excel process for the Armspan and Height data. What is the equation of the best fit line (we'll use this again in a future lab)?
- What is the R2 value written as a percent?
- What is the strength of the relationship?
- Examine the data closely. Is the data feasible for our class?
- Take a look at this graph:

This is some of the same data, but I removed some points that contradicted the related text that accompanied Leonardo da Vinci's Vitruvian Man: "The length of a man's outspread arms is equal to his height." What is the new R2 value written as a percent? - Compare the graphs. As a researcher, is it ethical to remove the points that I eliminated and keep the remaining points? Why or why not?
- How does the removal of the points affect the line (is the line steeper or more horizontal)?
- Explain why the removal of the points
has such a huge effect on the R2 value as you address
what it is R2 measures. You may wish to review the strength of the regression relationship
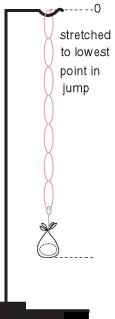
Egg Bungee Jump Regression - Based on a lab by Dr. Holly Hirst. Work in a group of 4, but each person should answer the questions on a separate piece of paper. Today we will let you decide how long to make the bungee cord for a fragile jumper -- a raw egg. The goal is to make it exciting but not fatal for your jumper. A small prize will be given to the group that gets closest to the ground without harming their egg. There is only 1 egg per group.
The Experimental Stage Gather your data as follows: - Be very careful with your egg - protect it from hitting anything
and make sure that it doesn't swing back and hit the meter stick.
Accuracy is important, so
the same person should drop the
egg each time.
Make 3 jumps each with 2, 3, 4, and 5 rubber bands from a height of 1
meter. You may use a pen and hold it perpendicular to the top of
the stick so that you drop the egg sufficiently far away from the meter
stick.
Record how far the egg travels from the top of the
meter stick to the point closest to the ground (12 data points).
Excel and Data Analysis Enter your data as two columns and repeat the Excel process to create a scatterplot, best fit line, and R2 value.Number of rubber bands
Distance dropped (cm)
2
2
2
3
3
3
4
4
4
5
5
5

- REGRESSION LINE:
R2 VALUE:
- Even with the variability in rubber bands and possible measurement inconsistencies, using the r2 value, your number of rubber bands should be a strong predictor of the distance traveled because the stretch ability and similarity of the rubber bands shows a constant slope for the change in distance dropped / change in rubber bands. EXACTLY what prediction of the number of rubber bands required for 2.0 meters does the equation of the regression line give (plug in 200 cm as the y-value and solve for x using algebra)? SHOW WORK!
- The Contest
Using the predicted number of rubber bands, the R2
value, and anything else you want to factor into your decision,
decide how many rubber bands you will use for the
2.0-meter bungee jump. You may be creative and
fold a rubber band in half. The team that comes closest to the ground
without any egg damage wins.
Build, but DO NOT TEST
the bungee machine. Name your egg (Egger Allen Poe?) and put a slip of paper with a) your group name, b) your best fit line and R2 value, and c) how many rubber bands you used,
and bring it up front
in the bowl as you continue to work below. Your egg dropper will drop the egg
when I bring us together, and I'll also need some volunteer judges.
Gapminder - Go to Gapminder Tools. Even without R2 in front of us, we can visually inspect and categorize relationships. - Do you think in 2018 Income is at least a statistically moderate predictor of Life expectancy (i.e. moderate/strong versus a no/weak correlation)?
- Hit the play button at the bottom left of the graph. Is the statistical relationship similar across all time?
- What happened around 1917/1918 to cause the dips?
- Click on and play "How to Use." Next modify the variables on the x and/or y axis, i.e. change Income and/or Life expectancy to explore various relationships, and keep track of ones you found especially revealing. List at least one here.
- Name at least one item that you found interesting or surprising, or that you had a question on. Continue exploring Gapminder until we come back together.
Does Random Number Choice Predict Armspan?