Representations of Data
We will use creative inquiry
techniques
to analyze large data sets with many dimensions of data.
Work in the same group that you created your
stock market data and graph.
Certain questions are labeled as
Critical Analysis - these require more thought and the
in-depth responses distinguish the college perspective from what
you might have seen in previous stats classes in middle grades.
Test 3 questions will be similar to these types of questions.
Class Data
Click on this Class Data Excel File.
The computer should then download the file.
Open the file classdata.xls from Excel.
You will see an Excel table filled in - I took the data
from the survey you filled in, and put it into Excel. (To try and
maximize anonymity I removed some columns, although we'll see the results of
that data in other ways).
Height and Armspan Averages
- Click on O2, an empty box. Calculate the class average of armspan using
=average(d2:d61)
What is this average?
- Click on O3. Calculate the class average of height.
What is this average?
-
Search the web
to find information about Leonardo da Vinci's speculation
about the relationship between armspan and height. Summarize what you found
in your own words.
- Search the web to find information about the "ape index" and its
relationship to rock climbing and summarize what you found.
Then identify yourself on the class data list, looking at your survey
submission online if necessary, but don't tell
anyone else which row you are in! Calculate your own index and write
down the definition you used.
Review: Mean and Median as Measures of Center
Mean/Average To calculate the average of a bunch of numbers, we
add them all up, and then divide by how many numbers we have. It is
the center with respect to weight and distance.
Median To calculate the median, the center with respect to location that divides the data in half,
we first put our data in increasing order, and then find the middle number
and place. If there is no such middle number, we take the 2 numbers
next to the middle place, and take the average of them.
For example,
0,0,1,3 has an average of 1, since we would take (0+0+1+3)/4 = 1.
It has a median of .5, since the middle place is between the 2nd 0 and the 1.
Since there is no actual number in this place, we take the average of 0 and 1,
which is .5.
The median is both a place and a number.
Mean and median are different measures of the data's
"center", and certain circumstances reveal different pros and cons.
Number of Siblings
- Click on O4. Calculate the class average of the
number of siblings. What is this average?
Here I have ordered the sibling
data, which is in blue, and annotated the median, where 50% of the data is on either side. In this case, since
it is in between 2 numbers, we take the average of the ones surrounding it:
0
0
0
0
0
0
0
0
0
0
1
1
1
1
1
1
1
1
1
1
1
1
1
1
1
1
1
1
1
1
[median is here middle of the data]
1
1
1
1
1
2
2
2
2
2
2
2
2
2
2
2
2
2
2
2
2
2
2
3
3
3
3
4
4
9
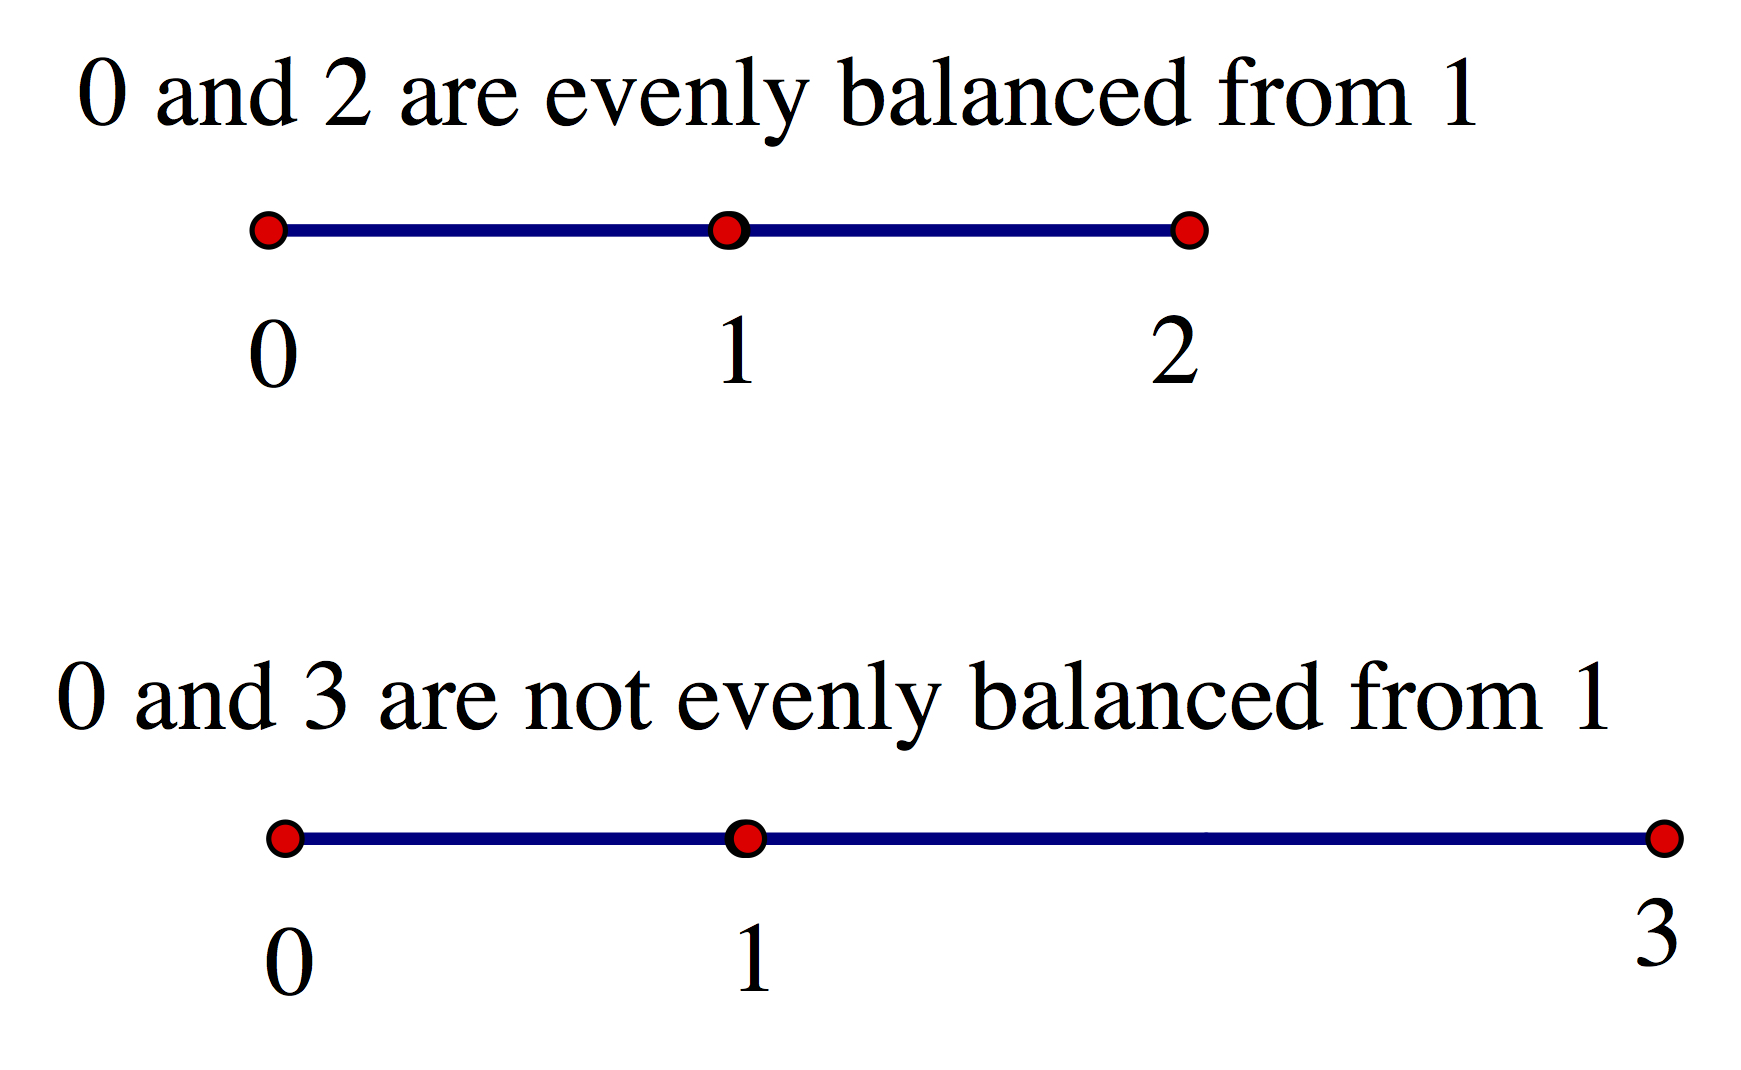
Scale Balancing Idea:
Compare the average to the median.
If you think of the median place as the middle of a scale of the ordered numbers, then the lower
numbers pull the average down
while the higher numbers pull it up. While there are an equal number
of items on
either side of this scale, the average equals
the median only when these pulls (the spreads) cancel each other out, only
if the data is evenly weighted about the median.
This does not happen in this case.
What is a reasonable measure of center in this case? Well, the median
is the actual center of the data and so it
is a good measure of location center. In this case it tells us that half the class
has that many or less siblings.
Notice that while the average is not a number in our data set,
and it is not exactly the center of the data, it does tell us about the
distribution of the data and is the center when considering distances from it.
Scale Balancing in Our Siblings Data:
In our data notice that the average is
higher than the median
since the data is
not
weighted evenly about the middle place. To understand this using a
scale balancing idea, observe that all those 1s have no pull because they are
the same as the median. The 2s balance out 0s, since they are
each 1 away from the median, but there are less 0s, so we already see that the average
will be dragged up.
In addition, there aren't any numbers below the median to balance out the 3s, 4s, and 9
since there aren't any negative siblings.
So the average is dragged up.
Distance from Home
- Click on O5. Type in
=median(c2:c61)
What is this median?
- Use Excel to calculate the class average of the distance
from home in O6. What is this average?
- On your paper copy of the class data I have
ordered it by distance from home. Mark where the
average and median are (just like I did for the median with the
number of siblings).
- Critical Analysis:
Explain why the average is larger than the median by using the idea of
a scale balancing about the median-- refer to the
home data and analyze the balancing and pulls of the numbers
(like I did for
Scale Balancing in Our Siblings Data---it should be a number of sentences or a paragraph).
Make sure that I have checked over your numerical answers.
Then, under File, release on Close, and click on Don't Save.
Stock Market Data
Open up your Excel data on the stock market from your email
(do not delete the email - we will use it again in future labs).
You may need to click on Sheet1 if the graph opens up.
The Mean and Median of Volume
Volume is the number of shares
bought or sold in a given day, and is represented on your graph by the bar
chart, with each day given, and numbers read to the left.
-
What Excel box contains the first data entry for your Volume data? (is it B2?)
- What Excel box contains the last data entry for Volume data?
- Click on G2, which is empty, and calculate the
average of Volume. What is this value?
- Calculate the median of Volume
in G3 (Excel can calculate using the median command even when the data
is not in order). What is this value?
- Take out your physical copy of the graph. The volume is represented as
the bar graph. To read the volume on a given day, you go to the
top of the corresponding
rectangle, go over to the left of the graph, and then read the
number from there.
Draw a horizontal line
at the point on the y-axis which matches the
median of Volume on this graph. This may or may not actually
correspond to a specific day that attained this volume, but you should
see that half the bars are above and half below.
Show me so that I
can mark off that you have done this correctly.
-
Critical Analysis:
Recall that the median is the middle place after we put the data in
increasing
order and that if we think of this as the center of a scale, then
we can see whether the mean is higher or lower by seeing whether the data
tips the scale to one side or another (you may wish to review my
explanation in the Sibling section above).
Even if the data is not in increasing order (on your stock graph for Volume
it is not),
we can still use the idea of the median as the center of a scale to see
whether the data tips the scale higher or lower than the median.
Use only the Volume bars on your stock graph and your knowledge of
mean compared to median to discuss why you can see from these bars whether
the mean is above or below the median - address using a scale balancing idea
like I did for siblings.
The Mean, Median and Boxplot of High
High is the highest price that
a stock hits each day. On your graph, the high is on the top of the boxplots
and is read by looking at the axis on the right.
- What is the average of the data in the High column?
- What is the median of the data in the High column?
- What is the smallest High value? You can use a command like
=quartile(D2:Dfillin,0) where you fill in the number of rows of data you have.
The quartiles are the 25% markers, so the 0th quartile is the lowest
data point.
- What is the largest High value?
You can use a command like =quartile(D2:Dfillin,4) where you fill in the
number of rows of data you have.
- Critical Analysis:
In questions #16 and #17, many of you may have similar
numbers even though your stock fluctuated up and down from one
day to the next (as any stock data typically does!).
Explain what is going on using the data, including
the spread from #18 to #19.
- Notice that you now have lo, median, and hi.
Compute the other quartiles in Excel, q1 and q3, and write them down.
- Use the five numbers lo, q1, median, q3, hi to create an axis that is roughly to scale, and then
sketch a boxplot of the High price.