Eliminate people who contradict the clue and remember nonsense words at least as well as real words. Choose a color for this clue and highlight any eliminated rows in that color. You'll eliminate 6 people.
-What are lower and upper boundaries for the interval rounded to 3 decimal places (Hint: use 1.618 and the margin of error)?
lower boundary: _______________ upper boundary: _______________

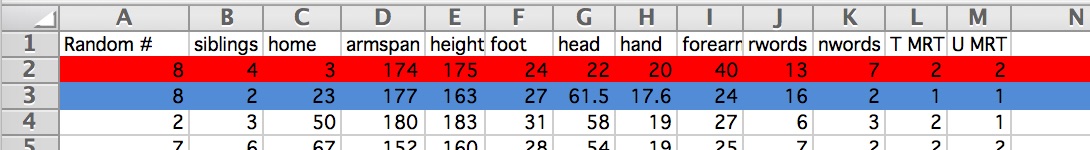
-Which column letter represents forearm? _______________ hand? _______________
-If we wanted to look at the ratio of columns J/I in Excel for person 2, we would use the Excel cell referencing command =J2/I2. Using Excel cell referencing, what is the Excel formula for forearm/hand for the first person in row 2 (don't forget the equal sign and use the columns you listed above rather than J and I)?
_______________ Type this into K2 and hit return. Go back to that box, go to the bottom right until you see the symbol change to a black plus, click and fill down the column for the forearm to hand ratios. Here is the fill down helper video, if you need help.
-Eliminate those remaining who contradict the statement and have a ratio outside the interval since the suspect is within. Choose a clue 2 color and highlight any new eliminations in Excel. Eliminate anyone who hasn't already been eliminated that is less than the lower boundary or greater than the upper boundary. You'll eliminate 32 new people from consideration.
-First, as a review, compute in Excel the 5-number summary in some empty boxes, using the following commands, and then roughly sketch the boxplot by-hand by creating a reasonable scale for the axis. Be sure that your commands match these:
Excel work: By-hand sketch:
Q4 or maximum: =quartile(b2:b54,4) _______________
Q3: =quartile(b2:b54,3) _______________
Q2 or median: =quartile(b2:b54,2) _______________
Q1: =quartile(b2:b54,1) _______________
Q0 or minimum: =quartile(b2:b54,0) _______________
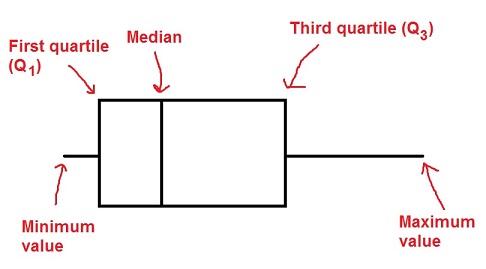

-Now eliminate rows who contradict the statement and who fall strictly outside the box borders - i.e.
eliminate those who are strictly below Q1 or strictly above Q3. Choose a different color and highlight any new eliminations in Excel. You'll have eliminated 6 new people. Also verify that you have 9 people remaining at this point. If not, check your clues and compare with others.
-Which column does the clue apply to? _______________
-Use Excel cell referencing. What is the Excel command for Q3? (don't forget the equal sign) _______________
-After you execute the command in Excel in a blank box, what is Q3 of that column: ______
-Next, eliminate those who are different than Q3
-You should have eliminated 7 people and have 2 people remaining at this point. Write down the number of each row that is left.
_______ _______
-Use Excel to create the scatterplot and best fit line, like we did a couple weeks ago (you can review #3 in that lab for the instructions)
y=_____________________________
-Compute the predicted line value of height by plugging in the armspan (the x value) of ONLY your remaining suspects into the equation of the line to solve for the y value height. Show work. Also write down the actual height of each person from Excel.
Predicted height y=_____________________________ = ______________. Actual height=_______
Predicted height y=_____________________________ = ______________. Actual height=_______
-Compare the predicted line height value with the actual height and eliminate the person whose difference is greater than 12cm
-Which row is left as the "winner" _______
-Does the "winner" drag the line up or down? I.e. is their actual height value above (drags up) or below (drags down) the predicted line value?
-Circle one: up down exactly on the line
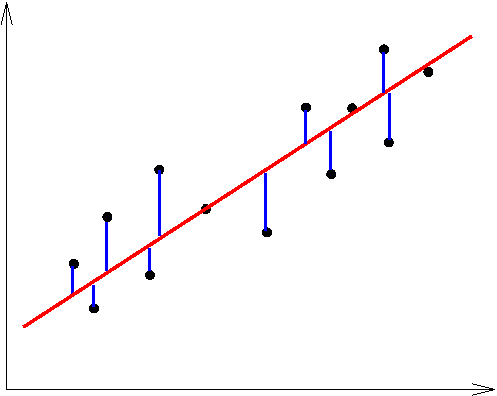
Notice that the closest to the line isn't actually the closest to Leonardo da Vinci's prediction because of all the class mismeasurements!