Egg Bungee Jump Regression - Based on a lab by Dr. Holly Hirst. Work in a group of 4, but each person should answer the questions on a separate piece of paper. Today we will let you decide how long to make the bungee cord for a fragile jumper -- a raw egg. The goal is to make it exciting but not fatal for your jumper. A small prize will be given to the group that gets closest to the ground without harming their egg. There is only 1 egg per group.
    The Experimental Stage Gather your data as follows:
  1. Make 3 jumps each with 2, 3, 4, and 5 rubber bands from a height of 1 meter. You may use a pen and hold it perpendicular to the top of the stick so that you drop the egg sufficiently far away from the meter stick. Record how far the egg travels from the top of the meter stick to the point closest to the ground (12 data points). Be very careful with your egg - protect it from hitting anything and make sure that it doesn't swing back and hit the meter stick. Accuracy is important, so the same person should drop the egg each time.

    Number of rubber bands

    Distance dropped (cm)

    2


    2


    2


    3


    3


    3


    4


    4


    4


    5


    5


    5


    Excel and Data Analysis Enter your data into excel, Click on the grey A box above the number of rubber bands data. The column will become highlighted. Click the command key, hold this down and then then click on the grey B box above the distance data. Now both columns will be highlighted. Under the Insert menu, look for and create the Scatter plot with the dots. Next use the control key as you click on one of the points on your graph and Add Trendline. Click on Options or Format Trendline and select the bottom two options (Display equation on chart and Display R-squared value on chart). Click on OK or x. Back on the chart, you can drag the equation of the line, if you need to see it better.
  2. REGRESSION LINE:                                                                    R2 VALUE:
  3. Even with the variability in rubber bands and possible measurement inconsistencies, using the r2 value, your number of rubber bands should be a very strong predictor of the distance traveled because the stretch ability and similarity of the rubber bands shows a constant slope for the change in distance dropped / change in rubber bands. EXACTLY what prediction of the number of rubber bands required for 2.0 meters does the equation of the regression line give (plug in 200 cm y-value and solve for x)? SHOW WORK!
  4. The Contest Using the predicted number of rubber bands, the R2 value, and anything else you want to factor into your decision, decide how many rubber bands you will use for the 2.0 meter bungee jump. You may be creative and fold a rubber band in half. The team that comes closest to the ground without any egg damage wins. Build, but DO NOT TEST the bungee machine and then put a slip of paper with your group names and bring it up front in the bowl as you continue to work below. Your egg dropper will drop the egg when I bring us together, and I'll also need some volunteer judges.
    Stock Market Data Download your stock file. Open Excel and then open your file using File/Open (yournamesotckname.xls).
    Does Date predict Close? Repeat the above Excel process for the Date/Close columns.
  5. Is the trend an upward trend, downward trend, or horizontal trend?
  6. What is the R2 value written as a percent?
  7. Critical Analysis: Predictors If your r2 value was 100%, explain why you wouldn't be assured to make money in the stock market by investing according to the line? Answer by referring to the related Stock Market readings and class discussions on financial forecasts.
    Does Volume predict High? Repeat the above Excel process for the Volume/High columns.
  8. What is the R2 value written as a percent?
  9. Statistically, using the chart, what kind of predictor is Volume of High (none, weak, moderate, or strong)?
  10. Critical Analysis: Lack of a Trend For most stocks, Volume will be a weak or no predictor of High. Take out your Excel chart from the stock packet and look for contradictions to a general trend between Volume (the bars at the bottom) and High (the tip tops). Ie find two consecutive days where the volume increases over time as the high increases, and two other consecutive days where the volume increases over time as the high decreases, or find some other similar information that would contradict a good fitting line relating volume and high. Apply the same reasoning as in the hw reading.
    Class Data From the class highlights page, go to this lab, and then click on this Class Data Excel File.
    Does Armspan predict Height? Follow the above Excel process for the Armspan and Height data.
  11. What is the equation of the best fit line?
  12. What is the R2 value written as a percent?
  13. What is the strength of the relationship between Armspan and Height (none, weak, moderate, or strong)?
  14. Take a look at this graph:

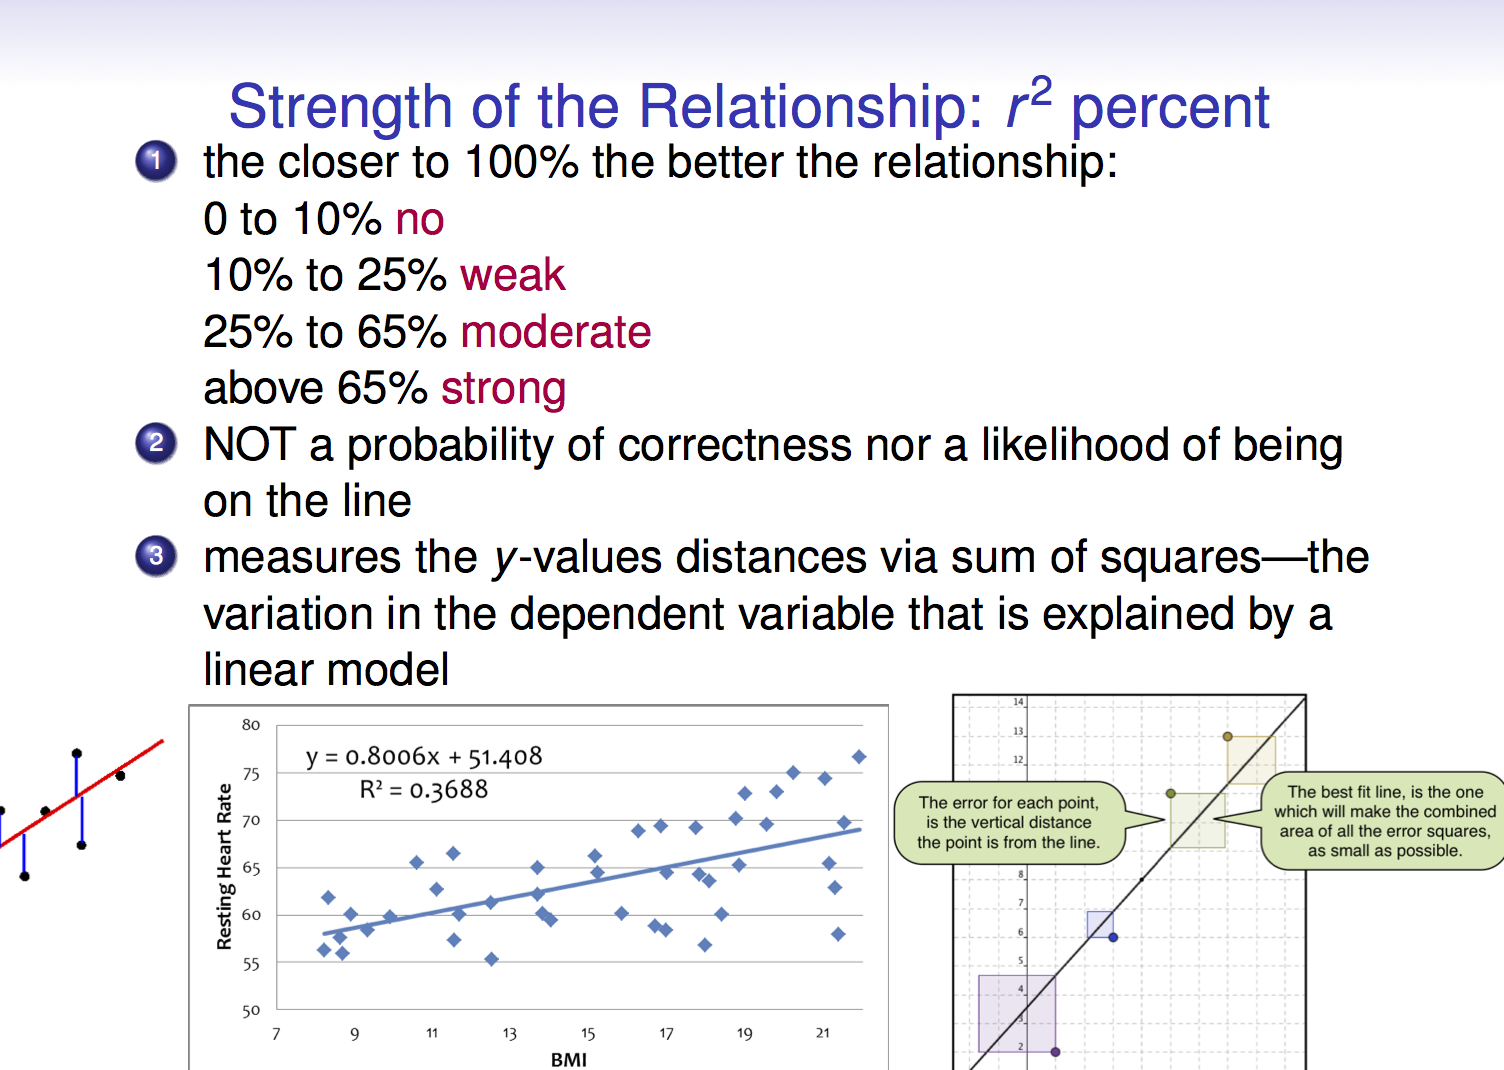
    This is some of the same data, but I removed some points that contradicted the related text that accompanied Leonardo da Vinci's Vitruvian Man "The length of a man's outspread arms is equal to his height." What is the new R2 value written as a percent?
  15. Critical Analysis: Ethics: Compare the graphs. As a researcher, is it ethical to remove the points that I eliminated and keep the remaining points? Why or why not?
  16. How does the removal of the points affect the line (is the line steeper or more horizontal)?
  17. Critical Analysis: R2 Value Changes: Using your knowledge of linear regression lines and predictors, explain why the removal of the problem points has such a huge effect on the R2 value. Be sure to address what it is the R2 value measures and relate this to your answer.