Probability and Chance in Birthday and Global Populations
Goal 1: critically analyze the role of probability and chance in real world situations
Goal 2: utilize technology to adapt and use mathematical formulas that include cell referencing to answer real-world questions and interpret results
Goal 3: interpret key features in an Excel table to investigate real world data
Birthday Simulations:
For homework you were to ask around to see whether any two people on your floor (or on social media or wherever) have the same birthday
(month and day).
Go to the Birthday simulation so that we can follow up. In a simulation, we can have a computer mimic real-life scenarios so that we can understand the likelihood of an event happening.
- First enter in 32 for the Number in room, and then repeatedly
Simulate
until you have conducted 100 Trials or so. What is the probability of a shared birthday among at least two of the people, according to the simulation?
- Next write on the front board the probability of a shared birthday among at least two of the 32 people.
- What is the number of people who responded in your homework?
- Click Reset and then enter the number of
people who responded in your homework and repeat the simulation for 100 trials.
What is the probability of two people having the same birthday now, according to the simulation?
- Did anyone in your homework actually have the same birthday? yes no
- Click Reset and then repeat the simulation for 3 for the Number in room, and then repeatedly
Simulate
until you have conducted 100 Trials or so. What is the probability of a shared birthday among at least two of the three people, according to the simulation?
- Check with your neighbors. Did any of you have a probability over 50% for 3 people?
- Once most of the class has written the probability for 32 people up on the board, then
examine the class responses to see whether they indicate that is would be a relatively good bet to find a shared birthday
among a group of 32 people. Here a good bet means greater than even odds (>50%). Is that the case?
Country Populations: Appalachian's strategic plan has a statement about sustainability: "Sustainability at Appalachian State University is not a trend, it is a tradition. We are active stewards of our... interconnected financial, cultural and natural resources... We balance critical, creative and global thinking in a living laboratory..."
Population sizes have a direct impact on sustainability such as resource distribution.
We have already seen that
country populations are important in financial measurements via the debt per citizen.
We'll continue to see connections in statistics and probability, in comparison of countries, in deciding about HIV testing, and more.
- Go to The World Bank population estimates and projections.
You should be under the Variables tab.
-Under Country click the check mark box to select all.
-Under Series scroll down to select Population, total
-Under Time select 2018
-Click on the Apply Changes box under Preview and you should see Afghanistan's total population in 2018.
-Click on Population, total there under preview, which brings up information on the indicator.
Read through the Long Definition.
-Who is counted?
-When are they counted?
-Back under the Variables tab, how many Series are Available
(today we are only going to look at one
column, but this would tell us the number of dimensions we could work in)?
- What are some real-life considerations in the problems in trying to count everyone in a country?
- Open this Excel file containing population data.
Populations are known to typically satisfy Benford's Law, which looks at
the frequency of the first digit and finds a pattern in the distribution.
-In G2 type
=LEFT(E2,1)
You'll see the first digit of Afghanistan. This is Excel's formula for extracting from the left side of an entry,
and in this case we are telling Excel to pull out 1 digit from the left, i.e. the first digit.
You'll also see increase by 1 a summary count of the number of countries whose populations have that first digit.
-Click on G2 and use Excel's fill down feature to fill the formula all the way to the last country. Here is a review of
how to fill
down from earlier labs: Move your cursor to the lower-right corner so that it turns into a black plus sign
 .
Click so that you keep the black + sign, hold down, and
fill down the Excel formula by scrolling down the column
vertically.
.
Click so that you keep the black + sign, hold down, and
fill down the Excel formula by scrolling down the column
vertically.
-In columns I and J you'll see the the numbers fill in. Copy down the data of the first digits and the number of countries whose populations have that first digit.
- To create a geometric representation of the data,
-Click on J2 and then scroll down (but DON'T fill down - i.e. leave the plus sign thicker and both white and black rather than
changing it to the black plus sign we use for fill down) to J10 so that the numbers are selected.
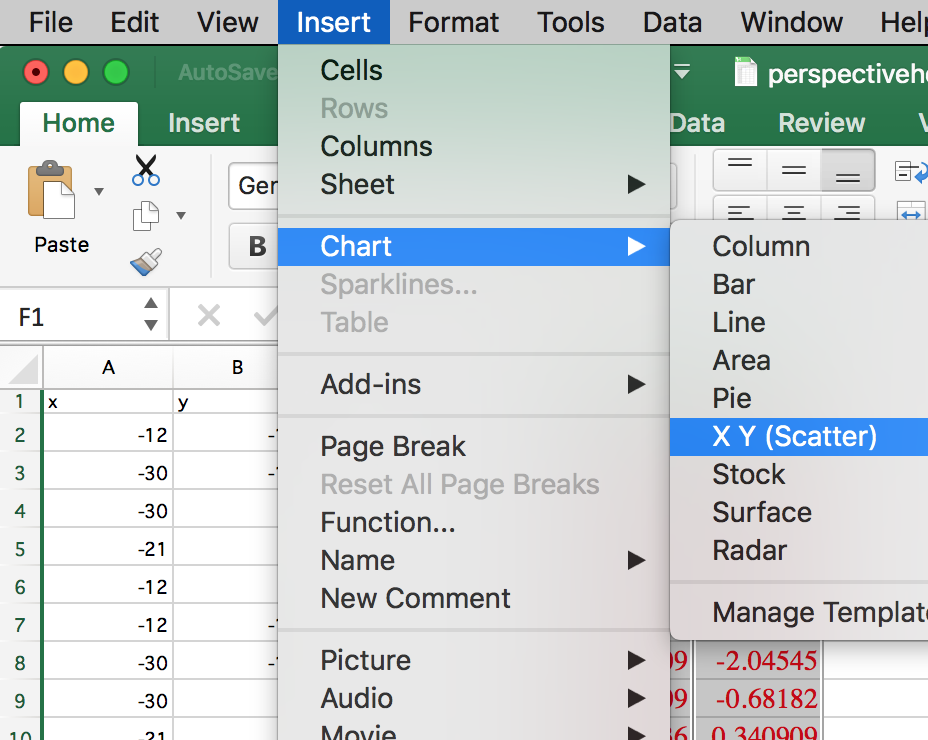
-Under Insert at the very top, choose Chart and then instead of selecting XY (Scatter) like we previously have (and will again soon), select Column
-Roughly sketch a graph of the data
-
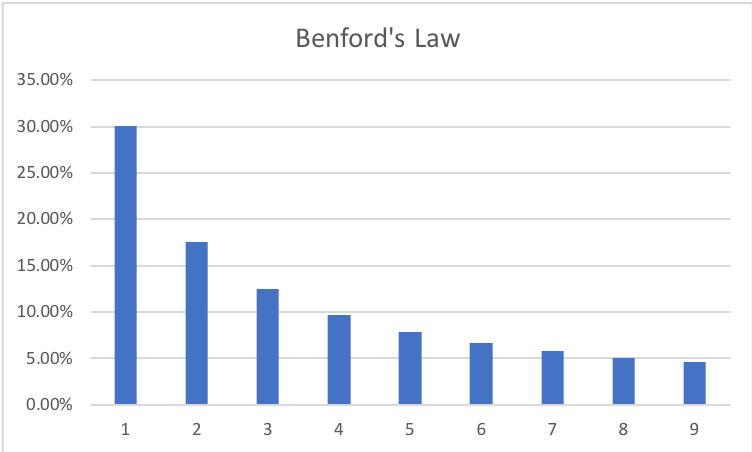
The first digit in many real-life data approximates a logarithmic trend (where 1 occurs about 30% of the time while 9 less than 5% of the time) such as populations,
elections, and stock prices. A common usage of Benford's law is in fraud detection. Here is an idealized column chart showing Benford's law.
Compare your Excel chart to the idealized one and critically analyze how well the 2018 country population data fits Benford's law.
- The first country's population is in E2 (row 2 column E). Scroll down to the end of the data.
What box contains the last country's population? E_______?
- Excel's command to add entries in column S from row 2 to row 15 would be
=sum(S2:S15)
What command will add all the populations in the E column? =sum( : )
- Enter this in Excel in F2 (don't forget the =). What is the total world population?
Search the internet for the total population and compare.
- Examine the data set. What population data is missing?
- Excel's command to find the smallest entry in column S from row 2 to row 15 would be
=small(S2:S15,1). Adapt this to find the smallest country population?
-What is the Excel command (don't forget the ,1 at the end)? =small( : )
-Enter in Excel. What is the population?
-What country has this population?
- Adapt the last command to find the largest country population?
-What is the Excel command?
-Enter in Excel. What is the population?
-What country has this population? It might help to make column E wider so that it shows all the digits rather than some in scientific notation.
- Take a look at the A and E columns. It might help to make them wider so that it shows all the name and digits rather than some in scientific notation. Write down something you found interesting or surprising.