A discrete dynamical system is a sequence of vectors ![]() related to one another by a square matrix A as follows:
related to one another by a square matrix A as follows:
![]() , for k = 0, 1, 2, ...
, for k = 0, 1, 2, ...
If we think of k as representing time in some units, we can think of a dynamical system as describing the evolving behavior over time of the set of variables represented by the vectors ![]() . We refer to this behavior as the "dynamics" of the "system" of vectors
. We refer to this behavior as the "dynamics" of the "system" of vectors ![]() .
.
====================
Example 1: To determine the long-term behavior of the vectors ![]() we'll examine the eigenvector decomposition:
we'll examine the eigenvector decomposition:
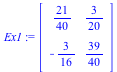
| > | Ex1 := Matrix([[525/1000,15/100],[-1875/10000,975/1000]]); |
 |
First we find the eigenvalues and associated eigenvectors of A:
| > | h,P := Eigenvectors(Ex1); |
, Matrix(%id = 18446744078190776182)](videos/dynamical2_7.gif) |
Therefore we have the eigenvector decomposition
![x[k] = Typesetting:-delayDotProduct(`*`(a[1], `*`(`^`(`/`(9, 10), k))), Vector[column](%id = 18446744078190771606), true)](videos/dynamical2_8.gif) +
+ ![]()
Since both eigenvalues are less than one in absolute value, then both ![]() and
and ![]() have limit 0. Now the vector
have limit 0. Now the vector ![]() tends toward the zero vector in the limit every
tends toward the zero vector in the limit every ![]() , so both the x-coordinate population and the y-coordinate population tends to 0. We sometimes say that the points
, so both the x-coordinate population and the y-coordinate population tends to 0. We sometimes say that the points ![]() are "attracted to the origin." Furthermore, since
are "attracted to the origin." Furthermore, since ![]() , then as long as
, then as long as ![]() is not 0, then the points
is not 0, then the points ![]() will be close to
will be close to ![Typesetting:-delayDotProduct(`*`(a[1], `*`(`^`(`/`(9, 10), k))), Vector[column](%id = 18446744078173733342), true)](videos/dynamical2_18.gif) for large k, which tells us that
for large k, which tells us that ![]() approaches the origin along a line with direction vector
approaches the origin along a line with direction vector ![]() ie y=(5/2) x.
ie y=(5/2) x.
====================
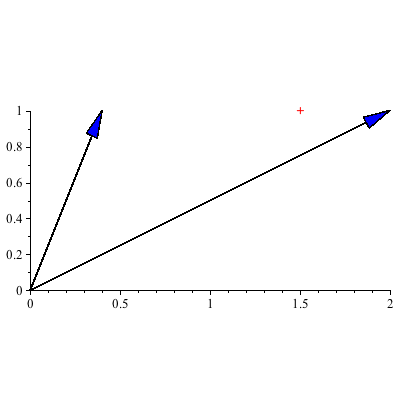
We plot the "trajectory" of the vectors ![]() , which is a plot of the points
, which is a plot of the points ![]()
Note: while we don't typically need the coefficients ![]() and
and ![]() , we could compute them as follows if we need them in applications:
, we could compute them as follows if we need them in applications:
| > | x0 := Vector([1.5,1]); |
| > | a := P^(-1).x0; |
| (1.1) |
====================
====================
Example 2: To determine the long-term behavior of the vectors ![]() we'll examine the eigenvector decomposition:
we'll examine the eigenvector decomposition:
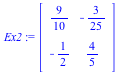
| > | Ex2 := Matrix([[9/10,-12/100],[-5/10,8/10]]); |
 |
| > | h,P := Eigenvectors(Ex2); |
, Matrix(%id = 18446744078105327966)](videos/dynamical2_30.gif) |
 |
The eigenvector decomposition is ![x[k] = `+`(Typesetting:-delayDotProduct(`*`(a[1], `*`(`^`(`/`(11, 10), k))), Vector[column](%id = 18446744078173734902), true), Typesetting:-delayDotProduct(`*`(a[2], `*`(`^`(`/`(3, 5), k))), Vector[c...](videos/dynamical2_32.gif) , where the values of
, where the values of ![]() and
and ![]() depend on
depend on ![]() . Since the larger eigenvalue of B is 11/10, the points
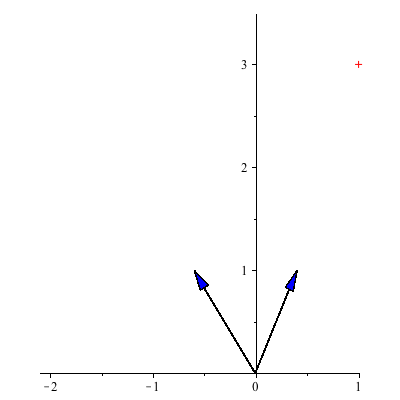
. Since the larger eigenvalue of B is 11/10, the points ![]() eventually move away from the origin and get arbitrarily far away. An associated eigenvector is
eventually move away from the origin and get arbitrarily far away. An associated eigenvector is ![]() , which tells us that as long as
, which tells us that as long as ![]() is nonzero, then eventually the trajectory follows the line through the origin y=-
is nonzero, then eventually the trajectory follows the line through the origin y=-![]() x.
x.
 |
However, note what happens below when the initial vector ![]() is an eigenvector associated with the smaller eigenvalue (ie
is an eigenvector associated with the smaller eigenvalue (ie ![]() =0). In this case we die off along the y=
=0). In this case we die off along the y= ![]() x line.
x line.
| > | x0 := Vector([.4,1]): |
 |
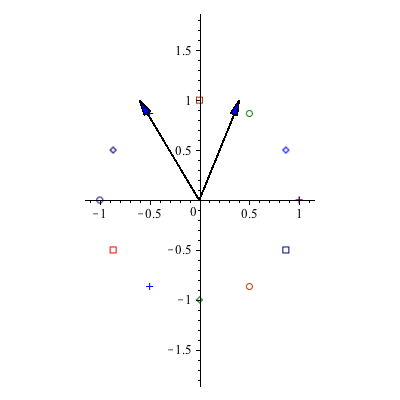
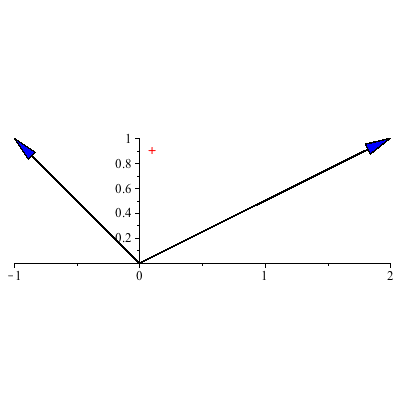
Example 3: To determine the long-term behavior of the vectors ![]() we'll examine the eigenvector decomposition:
we'll examine the eigenvector decomposition:
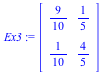
| > | Ex3 := Matrix([[9/10,2/10],[1/10,8/10]]); |
 |
| > | h,P := Eigenvectors(Ex3); |
, Matrix(%id = 18446744078190803174)](videos/dynamical2_47.gif) |
Thus ![]() .
.
The larger eigenvalue is 1 so, for most starting positions, the system tends towards the line y=1/2 x associated to the eigenvector ![]() . We can say a bit more than this as
. We can say a bit more than this as ![]() =1 and so
=1 and so
![]()
which is the line parallel to ![]() (since
(since ![]() changes over time) and through the tip of
changes over time) and through the tip of ![]() ie the place on y=1/2 x given by the starting position and a parallel transport there. So eventually we hit that line and then stay fixed there forevermore (unless
ie the place on y=1/2 x given by the starting position and a parallel transport there. So eventually we hit that line and then stay fixed there forevermore (unless ![]()
=0 in which case we die off along the y=-x line). For most starting populations, in the limit the populations will achieve the ratio of 2 of population a for each 1 of population b.
 |
====================
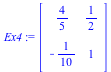
Example 4: Here is a system whose dynamics are more complicated:
| > | Ex4 := Matrix([[8/10,5/10],[-1/10,1]]); |
 |
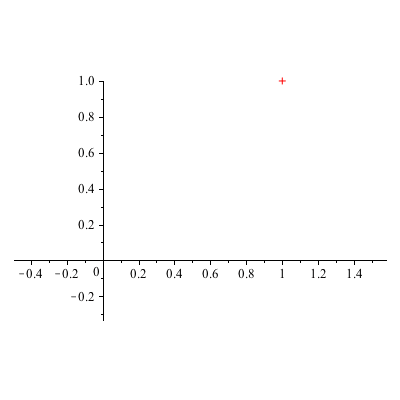 |
We sometimes say that the points are "attracted to the origin along a spiral." The spiral behavior is caused by the presence of complex eigenvalues.
====================